Figure 1.

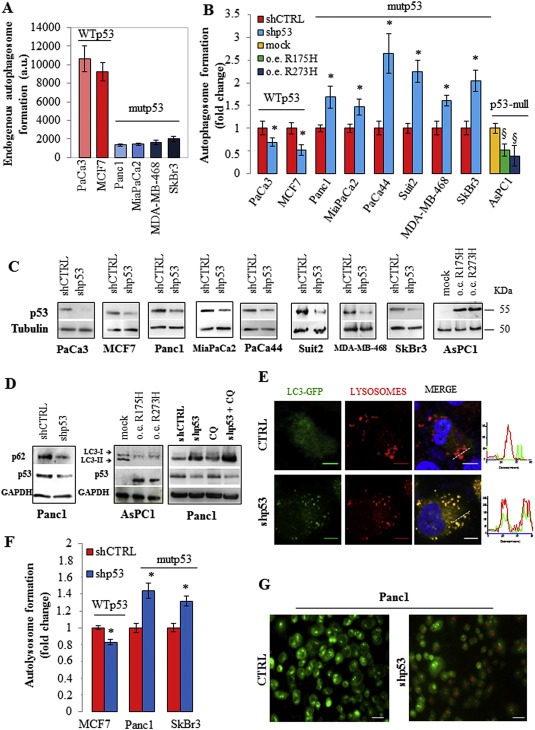
Mutant p53 counteracts autophagy. (A) The endogenous basal level of autophagosomes in cancer cells carrying WT or mutant p53 was analyzed using the incorporation of the fluorescent probe monodansylcadaverine (MDC). Cells were seeded in 96‐well plates, incubated overnight, and stained with MDC as described in Material and Methods. (B) Cells were transfected with the pRSuper‐p53 vector (shp53) to knockdown p53 expression (see Material and Methods) or with plasmids coding mutp53R175H, mutp53R273H proteins, or their relative negative controls (shCTRL or mock, respectively). Autophagosome formation assay was performed using the incorporation of MDC probe. (C) Western blot of p53 using the protein extract of the samples used for (B) to test the effective knock down of WT or mutant p53 and the overexpression of mutant p53 in the various cell lines indicated. (D) Panc1 cells were transfected with pRSuper‐p53 vector (shp53) or its negative control (shCTRL) and AsPC‐1 cells with plasmids for mutant p53 overexpression or its mock vector. Panc1 cells were pre‐treated with 5 μM chloroquine (CQ) for 1 h before cell transfection. Whole‐cell extracts were used for Western blot analysis of the autophagic proteins p62/SQSTM1 and LC3 (isoforms I and II), p53 and GAPDH (as control loading). (E) 48 h after co‐transfection with plasmids coding for LC3‐GFP and pRSuper‐p53 vector (shp53) or LC3‐GFP and the empty vector (negative control; CTRL), Panc1 cells were fixed. Lysosomes and nuclei were stained with Lysotracker (red) and Hoescht (blue), respectively. The RGB profile plotted along the dashed line drawn in the merge image is also shown. Merge and single channel images come from a single z‐plane. Scale bar 10 μm. (F) Autolysosome formation analyzed by red/green fluorescence intensity ratio quantification of acridine orange (AO) staining in the indicated cells transfected with pRSuper‐p53 vector (shp53) or with its negative control (shCTRL). (G) 48 h after the p53 depletion Panc1 cells were stained with an AO solution (1:1500 in PBS) and observed at 40× magnification. Scale bar 40 μm. All the experiments presented in this figure are representative of three biological replicates. P‐values were calculated with two‐tailed t‐test. Statistical analysis: *p < 0.05 shp53 vs shCTRL; §p < 0.05 R175H or R273H vs mock.
