
Figure 3.
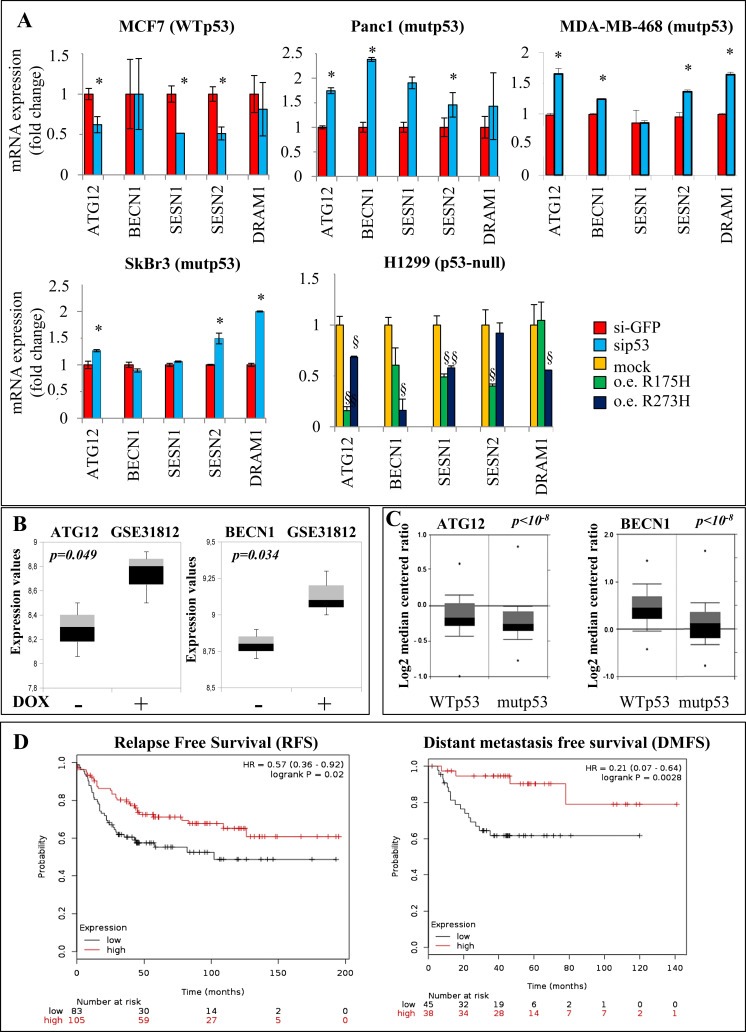
Autophagy‐related gene regulation by mutant p53. (A) The indicated cell lines were transfected with si‐p53 and si‐GFP (as control) oligonucleotides. H1299 cells were transfected with mutp53R175H, mutp53R273H or pcDNA3 (mock) vectors for 48 h. Gene expression analysis of the autophagy‐related genes ATG12, BECN1, SESN1, SESN2, and DRAM1 was performed by RT‐qPCR and was normalized to GAPDH mRNA. *p < 0.05 si‐p53 vs si‐GFP; §p < 0.05 R175H or R273H vs mock. All the experiments are representative of three biological replicates. P‐values were calculated with two‐tailed t‐test. (B) Box plot of ATG12 and BECN1 mRNAs expression obtained in MDA‐MB‐468 breast cancer cells by elaboration of data set from Freed‐Pastor and colleagues (Freed‐Pastor et al., 2012; Rhodes et al., 2004). (C) Box plots of ATG12 and BECN1 mRNAs expression in breast cancer patients (n = 72 for wt‐p53 and n = 72 for mut‐p53). Data from Gluck and colleagues were obtained from www.oncomine.org website (Gluck et al., 2012). (D) Kaplan‐Meier survival curves of relapse free survival (RFS) and distant metastasis free survival (DMFS) of breast cancer patients bearing mutant TP53 gene classified according to the expression of atg12, becn1, sesn1, and dram1 signature. RFS Statistically significant results with p‐value = 0.02, N = 188; DMFS Statistically significant results with p‐value = 0.0028, N = 83). The two compared groups are the patients with the highest expression (red) levels of the signature versus the patients with the lowest expression (black).