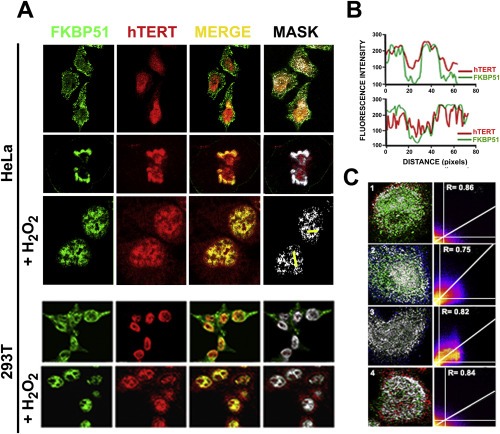
Figure 3.

FKBP51 co‐localizes with hTERT. (A) Colocalization of FKBP51 (green) and hTERT (red) by confocal microscopy in HeLa cells during interphase (upper line), mitosis (middle line), and peroxide‐induced nuclear accumulation of the immunophilin (lower line). Similar patterns were observed in 293T cells. (B) Intensity of fluorescence profiles of FKBP51 and hTERT for the yellow scan depicted in the nuclei of HeLa cells shown in the lower right corner. (C) True co‐localization analysis for non‐stimulated 293T cells (basal condition). Scatterplots shown an R colocalization values equal to or around 0.8, supporting the same subcellular distribution of both proteins.
