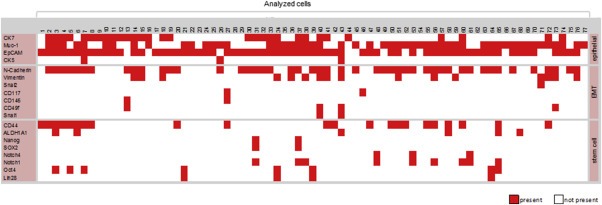
Figure 5.

Expression profiles of 77 single OvCar3 cells spiked into blood of healthy volunteers. Depicted is the expression of epithelial, EMT and stem cell markers (different rows) in 77 single OvCar‐3 cells (different columns). A signal was counted as positive reaching a signal intensity of >750 rfu in capillary electrophoresis and is color coded as present (red square). In general a cell was characterized as a tumor cell in case of positivity for PDH (cDNA) and at least one epithelial marker (constituted as present). A distinct intercellular heterogeneity between the 77 analyzed OvCar3 cells originating from one cell line was determined. Not all cells were found to be positive for mesenchymal (EMT) and/or stem cell markers. Furthermore cells with a co‐expression of epithelial–mesenchymal (EMT), stem cell‐mesenchymal (EMT) and epithelial–mesenchymal (EMT)‐stem cell markers could be observed.
