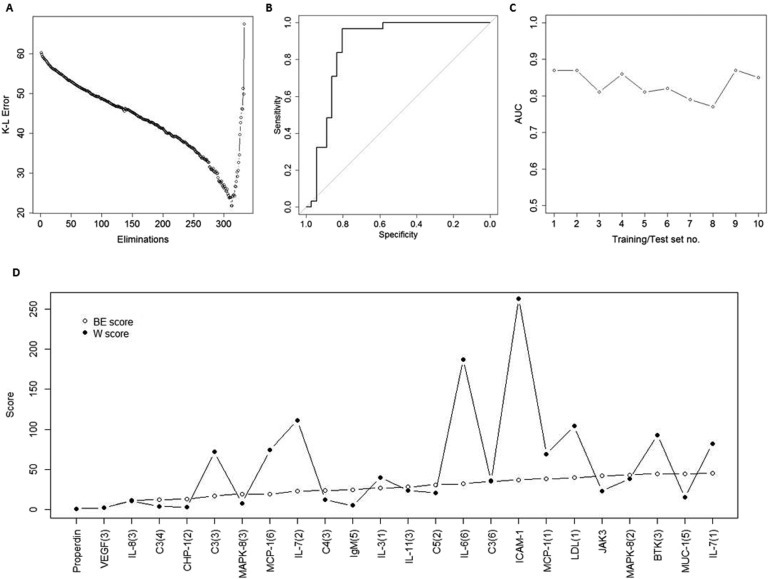
Figure 2.

Identification of plasma protein signatures for PDAC. A training set and a test set was generated by randomized selection of 2/3 of samples from each group (PDAC and NC) to the training set, and the remaining 1/3 of samples to the test set. The training set was used to define a condensed signature for discriminating PDAC from NC. (A) Filtering of variables was conducted by a SVM‐based stepwise backward elimination of the antibodies in the training set. In each iterative step, the Kullback–Liebler (K–L) error of the classification was determined and plotted. The antibodies that remained in the elimination process when the classification error reached its minimum value were used as a unique signature for constructing a new model in the training set; (B) ROC‐curve resulting from the signature model from the training set, “frozen” and directly applied onto the previously unseen test set samples; (C) The procedure was repeated to a total of ten times, in ten different sets of randomly created training and test sets. The area under the ROC‐curve (AUC values) generated by the frozen biomarker signature models in each corresponding test set were plotted; (D) The antibody score derived from the overall ranking in the backward elimination (BE) process (open circles) was compared to the score based on the Wilcoxon (W) test ranking (filled circles).
