
Figure 3.
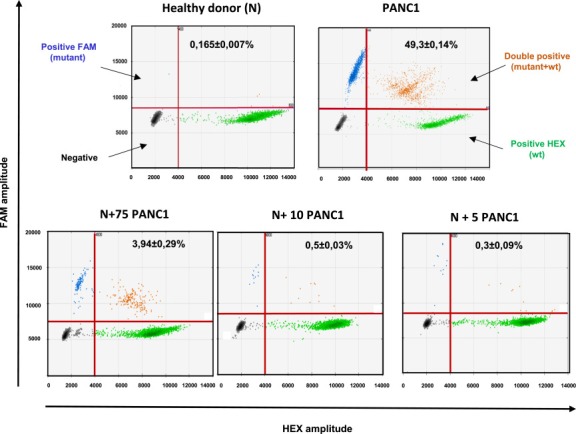
Detection threshold of KRAS from whole blood using droplet digital PCR. 2D‐Dot plot. Fluorescence results are plotted as two‐dimensional dot plots (similar to the depiction of flow cytometry data). The region of these plots can be sequentially separated based on the fluorescence intensity of each droplet. Grey dots correspond to empty droplets. Green dots correspond to droplets containing wild‐type copies of KRAS on codon 12–13. Blue dots correspond to droplets containing at least one codon 12–13 KRAS mutation. Orange dots correspond to droplets containing at least one KRAS wild type copy and one mutant copy. These droplets are considered for the analysis. Abundance ratio (KRAS mutant copies/total copies) is indicated for each dot plots. Each analysis was performed at least in triplicate. N, blood from “normal” healthy donors with no spiking of mutant KRAS cells. PANC1, blood from “normal” healthy donors spiked with PANC1 cells bearing the heterozygous c.35G > A mutation in KRAS codon 12 (Gly12Asp).