
Figure 4.
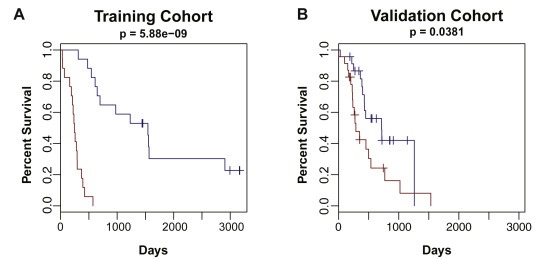
Kaplan–Meier analysis of the 19‐transcript model on the full training cohort (left) and validation cohort (right). A Cox regression model was trained on the full training cohort using the 19 transcript predictive model on short‐survival and long‐survival patients and evaluated on the full validation cohort. The short‐survival curve (red) represents patients in the lowest tertile of predicted survival time and the long‐survival curve (blue) represents patients in the top tertile of predicted survival time.