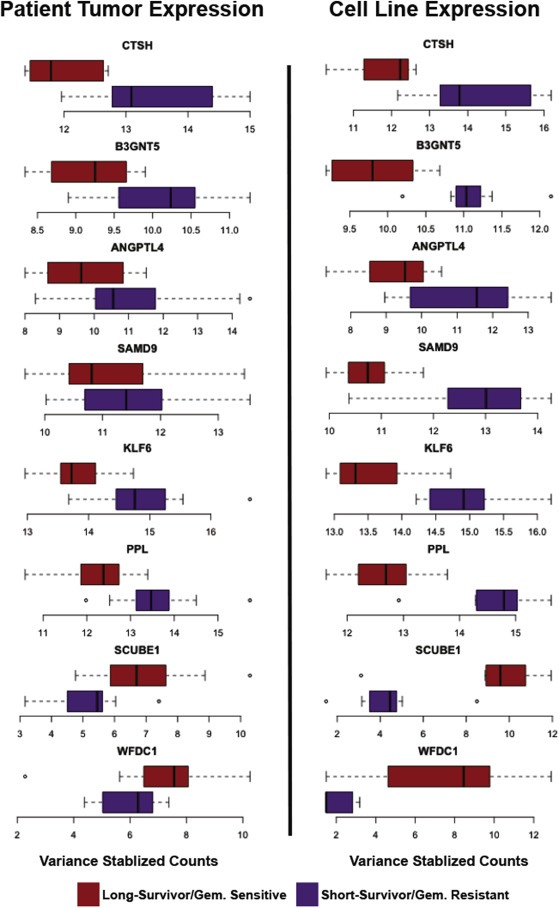
Figure 5.

Boxplots of transcripts significant between both short‐survival and long‐survival patients and gemcitabine‐sensitive and ‐resistant cell lines. Boxplots of DESeq2 variance‐stabilized data in pancreatic cancer cell lines and patient tissues demonstrate that most of these overlapping transcripts have a higher expression in the short‐survival patients and the gemcitabine‐resistant pancreatic cell lines. Purple represents short‐survivors/resistant cancer cell lines and red represents long‐survivors/sensitive cancer cell lines.
