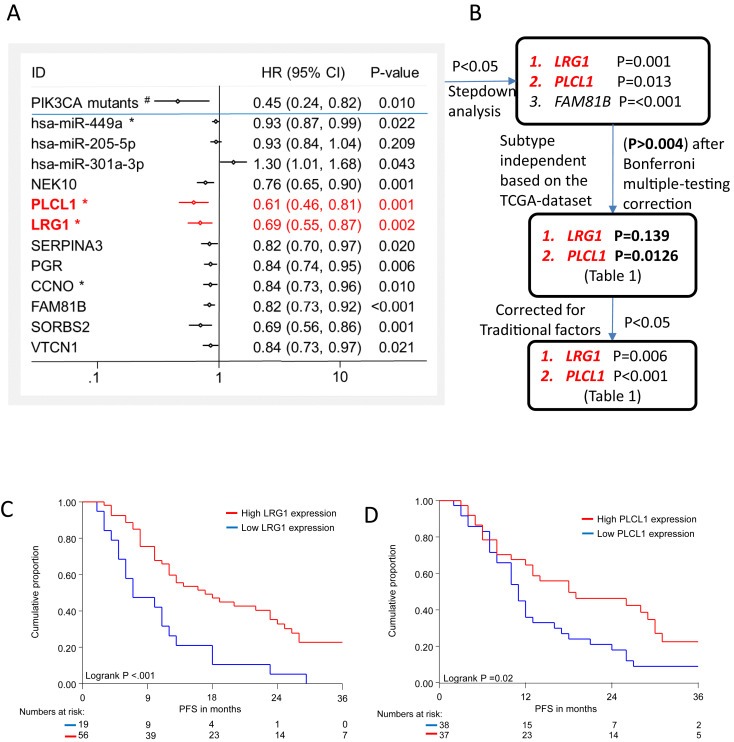
Figure 4.

Relation to PFS after first line AI treatment. Forest plot summarizing univariate analyses in 75 MBC patients in relation to PFS after first line AI treatment. Traditional factors are not included here. The variables in red remained significant in multivariate analysis after stepdown analyses and corrected for traditional factors. (#) indicates dichotomized variable, all others are continuous variables. All variables are up‐regulated in PIK3CA mutants except for miR‐301a‐3p. (*) indicates variables which are subtype independent, i.e. had no significant relationship (P > 0.004) with subtypes after Bonferroni multiple‐testing correction. B) Steps followed to identify independent potential biomarkers related to PIK3CA status and independent of subtype C–D). PFS analyses in 75 ER positive breast cancer patients with advanced disease treated with first line AI as function of C) PLCL1 expression and D) LRG1 expression.
