
Figure 1.
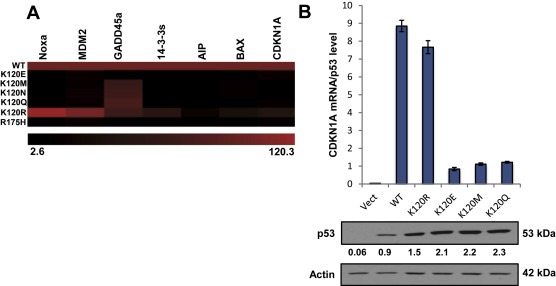
K120R is distinct from other K120 derived mutants. (A) Heat map representative of transcription activity of the p53 variant indicated on the left for various p53 targets, measured by fluorescence in a yeast screen assay (Kato et al., 2003) as referenced in the UMD TP53 Mutant Database. Values were taken as percentage of wild type (100%). (B) qRT‐PCR on RNA extracted from H1299 cells transfected with p53 for 48 h. CDKN1A‐mRNA levels were measured relative to GAPDH (bottom panel: Western blot of p53 expression for each transfection). CDKN1A‐mRNA levels shown were normalized to quantified p53 protein levels by Western blot. Error bars indicate ± S.D. Relative intensities, normalized to actin, for each p53 band are indicated.