
Figure 2.
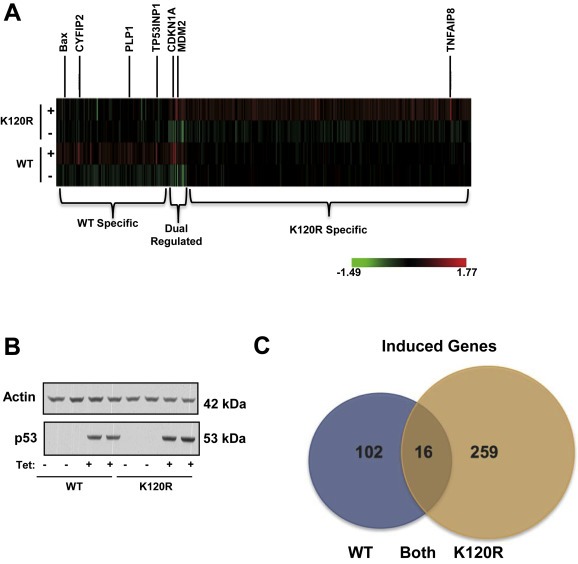
WT p53 and the K120R mutant induce distinct sets of target genes. (A) Expression profiling heat map generated with RNA extracted from H1299 cells with TO‐p53 (wild type (WT) or K120R). Cells were harvested 8 h after tetracycline treatment. Genes shown were up‐regulated ≥1.5 fold. (B) Western blot of whole cell lysates showing p53 induction in samples used to generate microarray profile. Profile was produced using biological replicates. (C) Quantification of heat map shown in (A). Number of genes induced ≥1.5 fold in each group are shown. Gene ontology analysis of the three groups is shown in Supplementary Table 1.