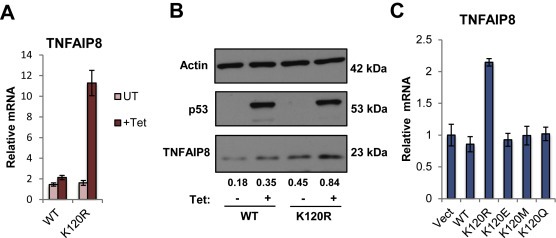
Figure 3.

Validation of TNFAIP8 as a target of the mutant K120R. (A) qRT‐PCR on RNA extracted from H1299 TO‐p53 cells. Cells were harvested 24 h after tetracycline treatment to induce WT or K120R p53 expression. TNFAIP8‐mRNA levels were measured relative to GAPDH. Error bars indicate ± S.D. (B) Western blot of whole cell lysates from TO‐WT or K120R cells harvested 24 h after tetracycline treatment. Relative intensities, normalized to actin, for each TNFAIP8 band are indicated. (C) qRT‐PCR of TNFAIP8‐mRNA levels measured from p53 mutant expression experiment shown in Figure 1B. Values were normalized to GAPDH. Error bars indicate ± S.D.
