
Figure 6.
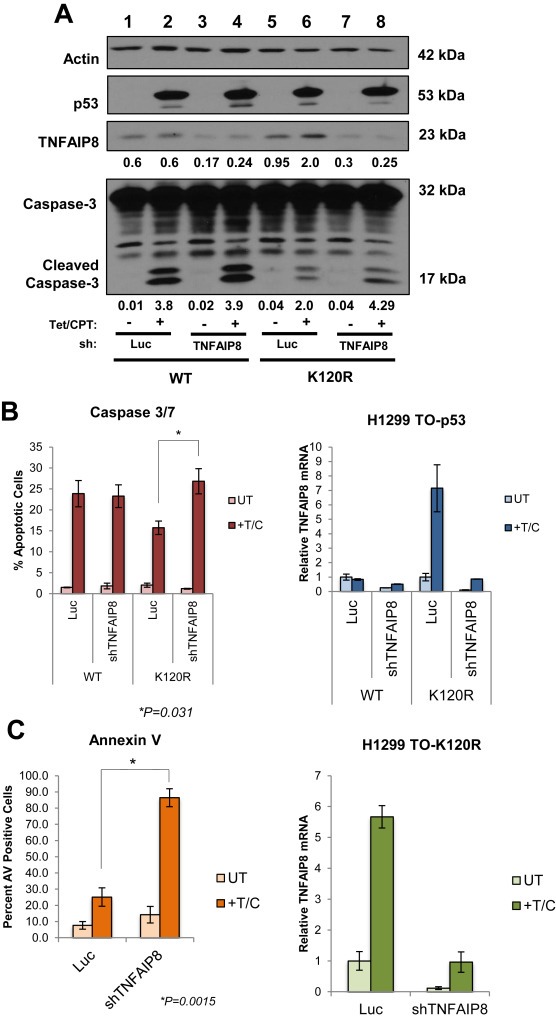
TNFAIP8 induction is important for evasion of apoptosis in K120R expressing cells. (A) Western blot of p53, TNFAIP8, Caspase‐3 and actin control from H1299 Tet‐inducible p53 cells (WT or K120R), 24 h after tetracycline and camptothecin treatment. Relative intensities, normalized to actin, for each TNFAIP8 and cleaved Caspase‐3 band are indicated. (B) Percentage of apoptotic cells treated as described in (A). Caspase 3/7 activity was measured by harvesting and staining cells then quantifying by flow cytometry. Percentage of apoptotic cells are represented as mean values, error bars indicate ± s.e. of three independent experiments, * indicates significance as calculated by Student's t‐test (p = 0.031). (C) Annexin V positivity was measured from stained cells treated as described in (A), then quantified as percentage of Annexin V positive cells by flow cytometry. Percentage of Annexin V positive cells are represented as mean values, error bars indicate ± s.e. of three independent experiments, * indicates significance as calculated by Student's t‐test (p = 0.0015). Right panel for (B) and (C): qRT‐PCR of TNFAIP8 mRNA levels measured from RNA extracted from cells used to asses apoptosis in (B) and (C). Values were normalized to GAPDH. Error bars indicate S.D. Data shown is representative of the triplicate experiments.