
Figure 2.
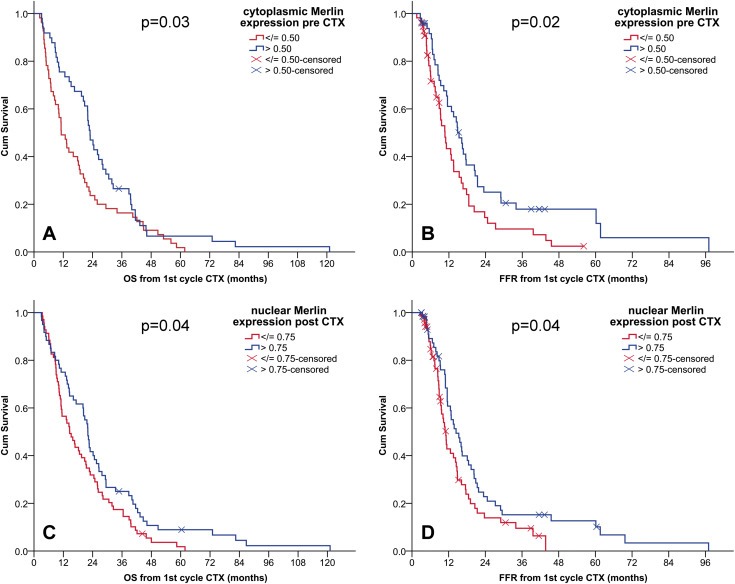
Low Merlin expression is associated with poor clinical outcome in MPM patients. Kaplan–Meier survival curves according to dichotomized expression of cytoplasmic Merlin in pre‐CTX samples (A: OS, B: FFR) and nuclear Merlin in post‐CTX samples (C: OS, D: FFR). CI, confidence interval; CTX, chemotherapy; OS, overall survival; FFR, freedom from recurrence. (A) median OS (months) (95% CI) low (n = 55): 11(8–14) vs high (n = 49): 23(20–26). (B) median FFR (months) (95% CI) low (n = 55): 11(8–13) vs high (n = 49): 15(12–18). (C) median OS (months) (95% CI) low (n = 69): 15(11–19) vs high (n = 60): 22(20–24). (D) median FFR (months) (95% CI) low (n = 69): 11(10–12) vs high (n = 60): 14(11–18).