
Figure 4.
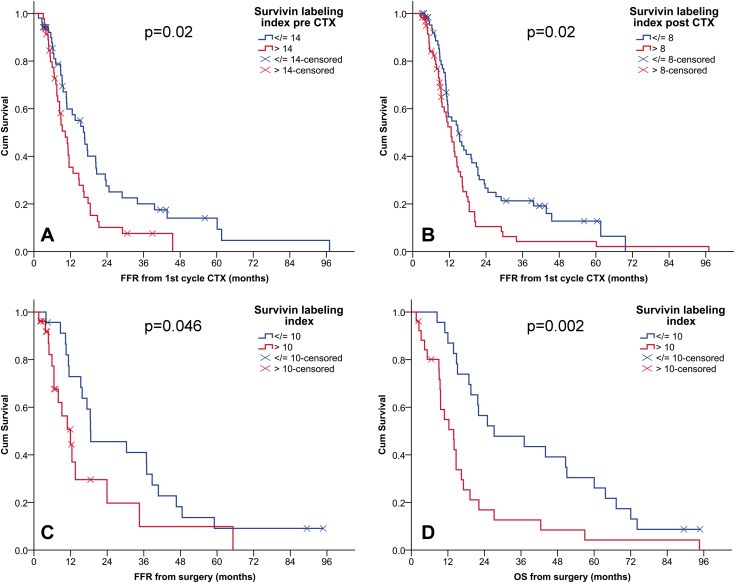
High nuclear Survivin positive index is associated with poor clinical outcome in patients from both cohorts. Kaplan–Meier survival curves according to dichotomized labeling index of nuclear Survivin, showing the association of high Survivin positive index in pre‐CTX (A) and post‐CTX (B) of cohort 1 with short FFR. Survivin positive index in chemo naïve tumors of MPM patient cohort 2 is associated with both FFR and OS (C, D). CTX, chemotherapy; OS, overall survival; FFR, freedom from recurrence; CI: confidence interval. (A) median FFR (months) (95% CI) low (n = 52): 17(12–21) vs high (n = 46): 10(8–13). (B) median FFR (months) (95% CI) low (n = 67): 15(10–19) vs high (n = 61): 13(10–15). (C) median FFR (months) (95% CI) low (n = 23): 19(4–33) vs high (n = 26): 12(7–17). (D) median OS (months) (95% CI) low (n = 23): 27(4–51) vs high (n = 26): 14(9–19).