
Figure 1.
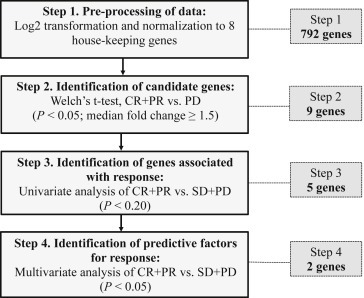
Flowchart for identification of differentially expressed genes associated with bevacizumab response. The number of genes shown in the right dotted box denotes the number of genes identified according to analytical steps.
Official websites use .gov
A
.gov website belongs to an official
government organization in the United States.
Secure .gov websites use HTTPS
A lock (
) or https:// means you've safely
connected to the .gov website. Share sensitive
information only on official, secure websites.
Flowchart for identification of differentially expressed genes associated with bevacizumab response. The number of genes shown in the right dotted box denotes the number of genes identified according to analytical steps.