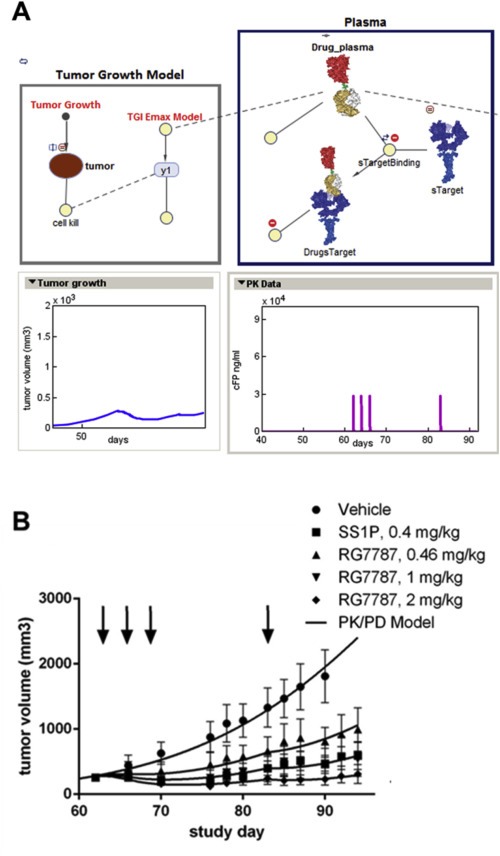
Figure 5.

Modeling the relationship between pharmacokinetics and pharmacodynamics (A) The scheme illustrates the different model parameters and their relationships to each other. (B) Model predictions correlate well with the observed experimental data. Tumor growth curves calculated by the model are represented by the solid lines, while the data symbols show actual measured tumor volumes. Vehicle data were used for model fitting until day 90. Up to this time point no animals had to be sacrificed based on predefined termination criteria.
