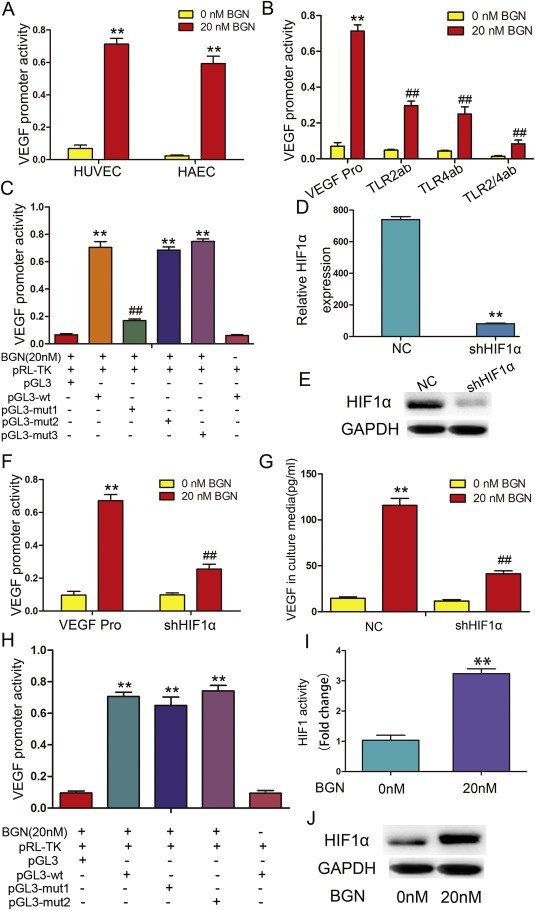
Figure 2.

rBGN induction of VEGF is dependent upon HIF‐1α. (A) HUVECs and HAECs were transfected with a VEGF promoter reporter plasmid (pGL3‐VEGF). Cells were stimulated with 20 nM rBGN 24 h after transfection, and VEGF promoter activity was measured 6 h later. (B) HUVECs were transfected with a VEGF promoter reporter plasmid (pGL3‐VEGF) in the absence or presence of antibodies to neutralize TLR2 and/or TLR4 receptor(s). Cells were stimulated with 20 nM rBGN 24 h after transfection, and VEGF promoter activity was measured 6 h later. (C) A reporter plasmid for VEGF (pGL3‐VEGF) was generated by cloning the VEGF promoter region (wt) or its HIF‐1α binding site mutants (mut1, mut2 and mut3) into the pGL3‐basic vector. BGN significantly increased the luciferase activity of the VEGF promoter region (wt), while activity was significantly reduced when mut1 replaced the wt sequence. Mut1 may contain a HIF‐1α‐binding site. (D–E) The mRNA and protein expression of HIF1α after downregulation in endothelial cells were determined via qPCR and western‐blot. (F) HUVECs were transfected with a VEGF promoter reporter plasmid (pGL3‐VEGF) in the absence or presence of vectors engineered to express shHIF‐1α. Cells were stimulated with 20 nM rBGN 24 h after transfection, and VEGF promoter activity was measured 6 h later. (G) HUVECs were transfected with negative control vectors (NC) or with vector engineered to express shHIF‐1α. Cells were stimulated with 20 nM rBGN 24 h after transfection, and VEGF expression was measured 9 h later. (H) HUVECs were transfected with vectors containing the VEGF promoter region (wt) or its NF‐kB binding‐site mutants (mut1 and mut2). rBGN significantly increased the luciferase activity of the VEGF promoter region (wt), while there were no significant changes in the mut1‐ or mut2‐transfected cells. VEGF promoter region may not contain NF‐kB binding sites. (I) HUVECs were stimulated with rBGN. Then, ChIP assays were performed via immunoprecipitation with antibodies to HIF‐1α, along with qPCR amplification of the isolated DNA fragments using VEGF promoter‐specific primers. The results are reported as the fold change relative to untreated cells. (J) Western blot analysis of HIF‐1α after stimulation with or without rBGN. GAPDH was used as a loading control. Each value is the mean ± SD of three experiments. ** Represents P ≤ 0.01 when compared to untreated control levels; ## represents P ≤ 0.01 when compared to stimulated control values.
