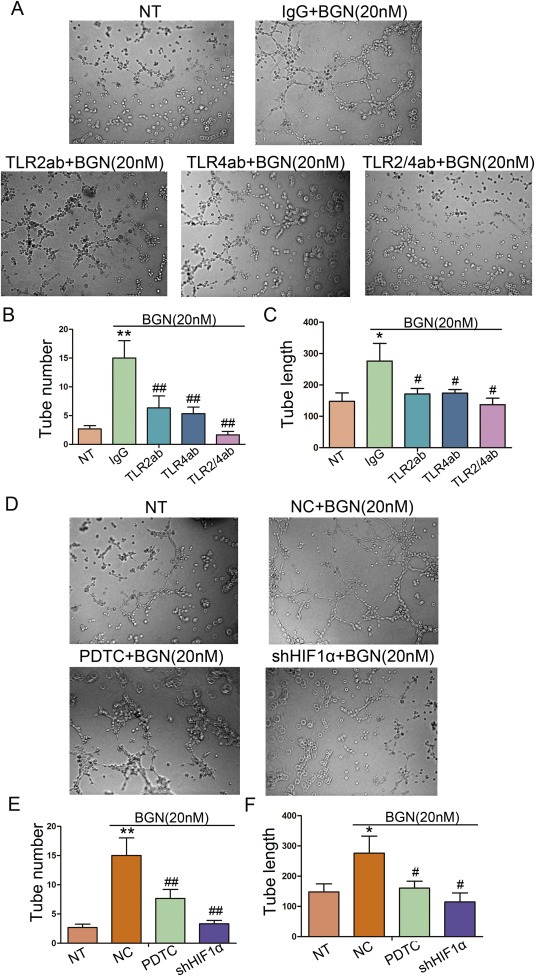
Figure 4.

rBGN activates endothelial cell tube formation through the TLR signaling pathway. (A) Richly formed tubular structures were observed in the groups stimulated with rBGN when compared with the observations of the untreated group, whereas HUVECs formed less well‐formed tubular structures when incubated with antibodies to neutralize TLR2 and/or TLR4 receptor(s). (B–C) Bar charts show the number of tubules (B) and the mean tubular lengths (C) for the different groups, which were incubated with antibodies to neutralize TLR2 and/or TLR4 receptor(s). (D) Richly formed tubular structures were observed in the groups stimulated with rBGN when compared with the observations of the untreated group, whereas HUVECs formed less well‐formed tubular structures when treated with PDTC or vectors encoding for shHIF‐1α. (E–F) Bar charts show the number of tubules (E) and the mean tubular lengths (F) for the different groups, which were treated with PDTC or vectors encoding for shHIF‐1α. Each value is the mean ± SD of three experiments. * Represents P ≤ 0.05 when compared to untreated control groups; ** Represents P ≤ 0.01 when compared to untreated control groups. # represents P ≤ 0.05 when compared to stimulated control groups; ## represents P ≤ 0.01 when compared to stimulated control groups.
