
Figure 2.
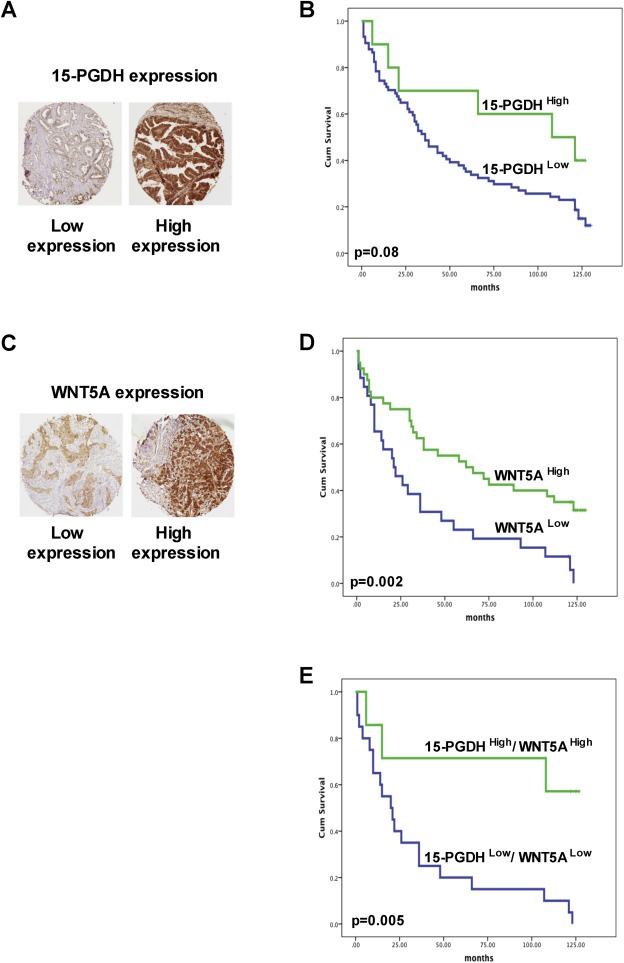
Kaplan–Meier survival curves of colorectal cancer patients with different levels of 15‐PGDH and WNT5A protein in their tumor tissue. A and C, Representative immunohistochemical images of low and high levels of 15‐PGDH and WNT5A expression in the tumor tissue from colon cancer patients. B, Kaplan–Meier survival curves of colorectal cancer patients with low or high levels of 15‐PGDH expression. D, Kaplan–Meier survival curves of colorectal cancer patients with low or high levels of WNT5A expression. E, Kaplan–Meier survival curves of colorectal cancer patients with low or high expression levels of both 15‐PGDH and WNT5A. Cumulative survival is shown in months, and the differences between the groups were assessed using log‐rank testing.