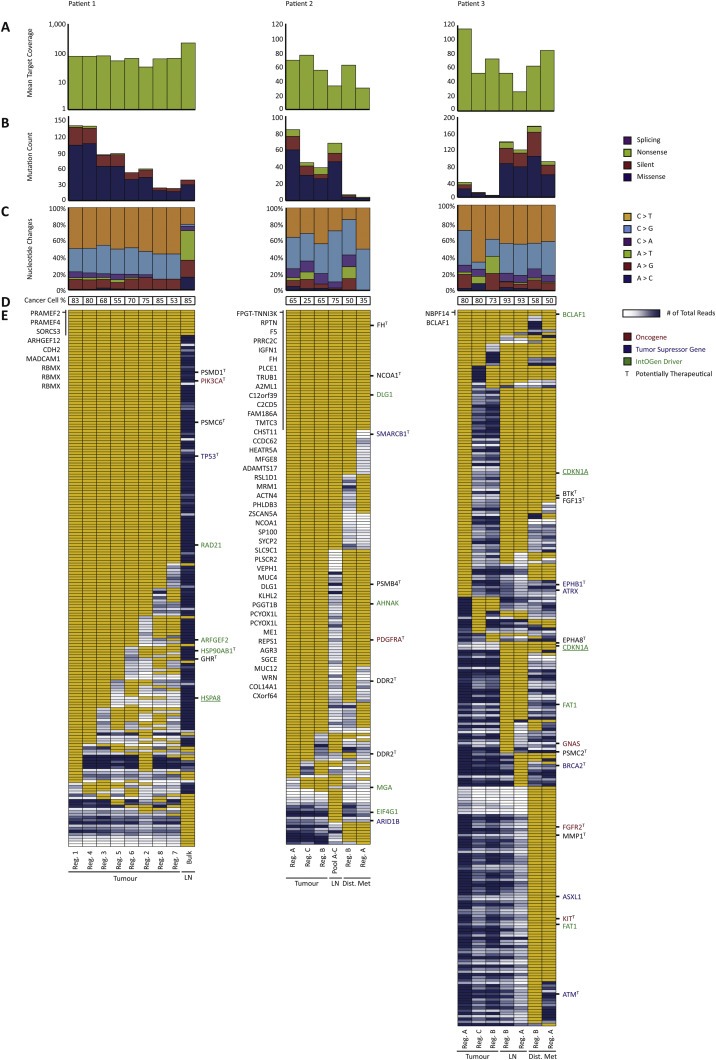
Figure 2.

Mutational landscape in primary tumours and metastatic lesions. (A) Mean target coverage obtained in whole exome sequencing (note that data for patient 1 is shown on log‐scale). (B) Mutation count and the distribution within missense, silent, nonsense, or splicing (including tiers 0–2, categories 1–2 mutations). (C) Nucleotide change distribution (including tiers 0–2, categories 1–2 mutations). (D) Cancer cell percentage. (E) Heat map of whole exome sequencing data in a dichotomized format (including tiers 0–1 mutations, called with a category score of 1 or 2 in at least one of the samples). Yellow: mutation present, white: less than 10 reads in the given position, blue range: mutation not present (presented with number of reads ranging from 11 to 1026 reads excluding the lower and upper 10% quartiles) with dark blue equalling high amount of total reads. Known oncogenes (red), tumour suppressor genes (blue), and IntOGen driver genes (green) are annotated to the right of each heat map. Underlined genes are of high impact having either gained or lost a stop or start site. To the left of the heat map, shared mutated genes are listed. Potentially therapeutic genes are marked with a T to the right of each heat map. Samples are ordered in descending number of mutations within primary tumour, the lymph node metastasis, and the distant metastasis in each patient. Lastly, if a mutation was called by Mutect with a category score of 1 or 2 in any of the samples within a patient, the remaining samples within the patient were manually investigated for the presence of the mutation. Thus, the number of mutations depicted in E does not necessarily reflect the numbers of mutations depicted in B. Reg.: Region, LN: Lymph node metastasis, Bulk: Exome on bulk DNA, Pool A–C: Pool of exomes, Dist. Met: Distant metastasis.
