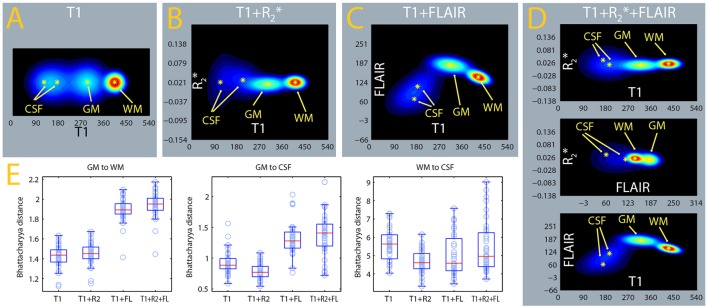
Figure 11.
Estimates of tissue class densities and relative separation. (A–D) : average signal densities from the MPRAGE, MPRAGE+, MPRAGE+FLAIR, and MPRAGE+FLAIR segmentations. The estimate from the MPRAGE segmentation alone was displayed as a two-dimensional density to facilitate comparison. The gray matter (GM) and white matter (WM) tissue classes were modeled with one Gaussian, while cerebrospinal fluid (CSF) was modeled as a mixture of 2 Gaussians. (E) Box-plots of the Bhattacharyya distances between the tissue classes computed in the individual segmentations. The distance of GM to CSF (box-plot in the middle) was computed to the Gaussian with largest weight in the mixture.

