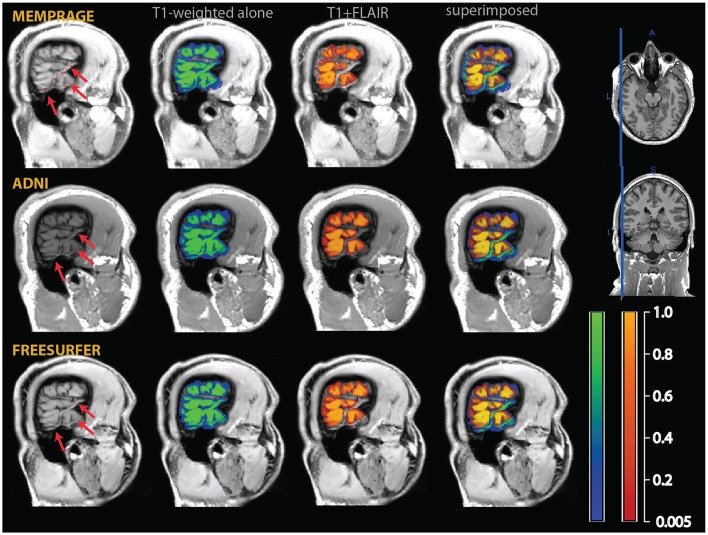
Figure 4.
Example of a misclassification of sulcal vessels as gray matter (red arrows and dotted red line in the T1-weighted images on the left). As in the previous figures, the segmentation of the T1-weighted images alone is shown as a blue-green overlay, and the multimodal segmentation with the added FLAIR images in red-orange. Note the vessels misclassified as gray matter by the T1-weighted segmentation (in green in the rightmost column of images), but not in the multimodal procedure.

