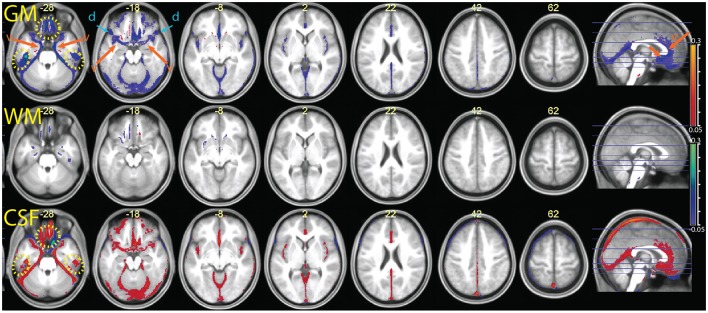
Figure 9.
Comparison of the segmentation obtained with the multimodal procedure using MPRAGE images and the signal, relative to a segmentation obtained with the MPRAGE images alone. Decreases of estimated GM volume amounted to an average 26 ± 11 ml in the combined relative to the simple segmentation. There were no appreciable differences in the WM volumes in the combined and simple segmentation (<1 ml). In the combined segmentation, CSF volumes were on average 11 ± 20 ml larger than in the simple segmentation. Colors and symbols as in Figure 5.

