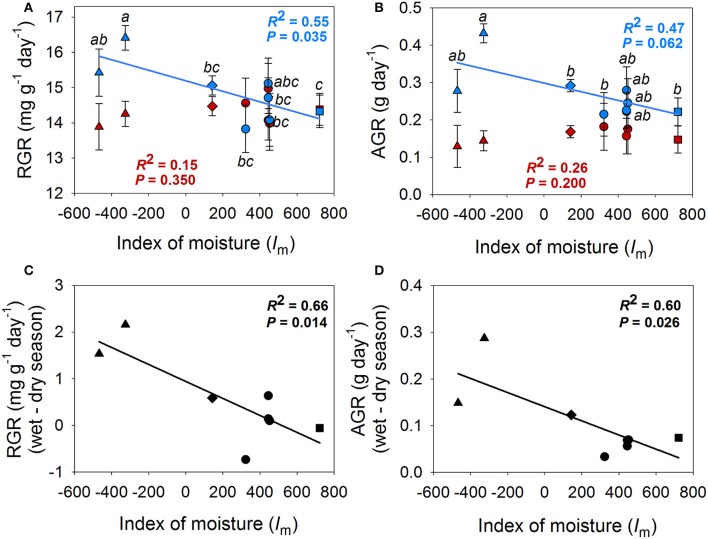
Figure 3.
Population means for relative growth rate (RGR) (A), absolute growt rate (AGR) (B) in the wet season (blue) and dry season (red) in realtion to the index of moisture of the population. (C) and (D) show the relationships between the difference in RGR and AGR between seasons and the index of moisture of the population (Im). Points indicate population means. Standard errors could only be calculated for intra-season means (A,B). Populations that belong to the same climate region are represented by the same symbols; Honduras: triangles, Dry Costa Rica: diamonds, Belize: circles, Mesic Costa Rica: squares.

