
Figure 3.
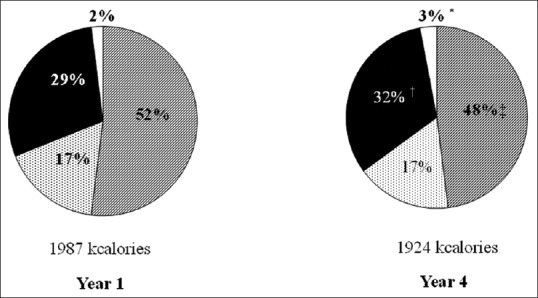
Mean caloric intake and distribution of macronutrients (as percentage of total kilocalories) of participants during year 1 and year 4 of medical school. *P = 0.02, change from year 1 to year 4;†P < 0.01, change from year 1 to year 4;‡P < 0.001, change from year 1 to year 4. Stripes represent carbohydrate; dots represent protein; solid black represents fat; solid white represents alcohol