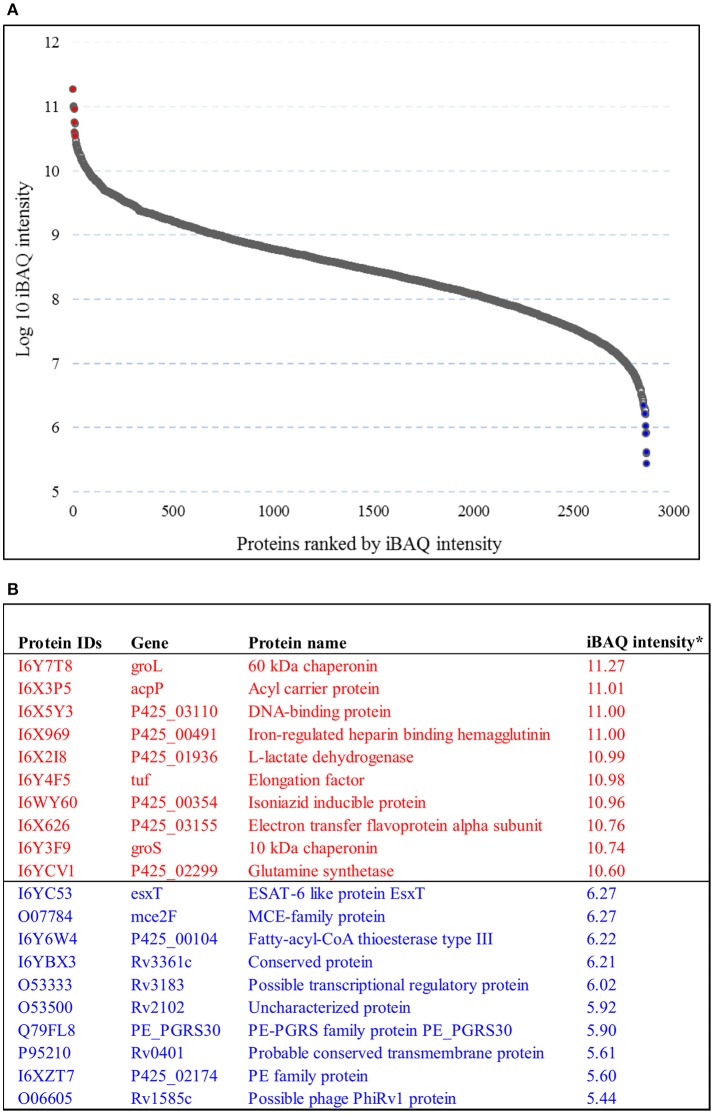
Figure 2.
Protein dynamic range estimation. (A) Combined intensity based absolute quantification (iBAQ) values for the 2,825 proteins were plotted with log10 iBAQ intensity on the y axis, and proteins were ranked by iBAQ intensity on the x axis. The plot shows a dynamic range of 6 orders of magnitude. (B) List of the ten most (colored red) and 10 least (colored blue) abundant proteins based on iBAQ intensity.

