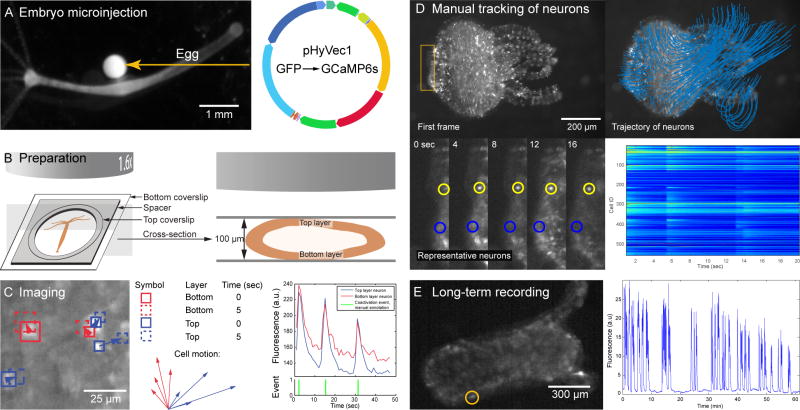
Figure 1. Imaging the entire nervous system activity of Hydra.
A. To create the transgenic line, we injected into fertilized Hydra eggs (left) a plasmid that causes expression of GCaMP6s (right). B. Imaging preparation (left) and sample cross-section (right). C. Left: trajectory of 5 representative neurons. Middle: close-up on the trajectory of the 8 tracked neurons, showing a difference in direction of the neurons of the top layer (blue) versus the neurons of the bottom layer (red). Right: Single calcium spikes in neurons from both layers (top; see also Figure S2), with manual detection of coactivation events (bottom). D. First frame (top left), trajectory of all neurons (top right), close-up on the position of 2 representative neurons (bottom left) and fluorescence (bottom right) of all the detected neurons during a typical recording. Measurements were made on the first 20 seconds (real time, i.e. 1.6 seconds of movie time) of Movie S1. E. Entire animal (left) imaged for more than one hour at 30 frames per second, with fluorescence signal (right) coming from the cell circled in yellow. See also Figures S1, S2 and S4 and Movies S1 and S2.

