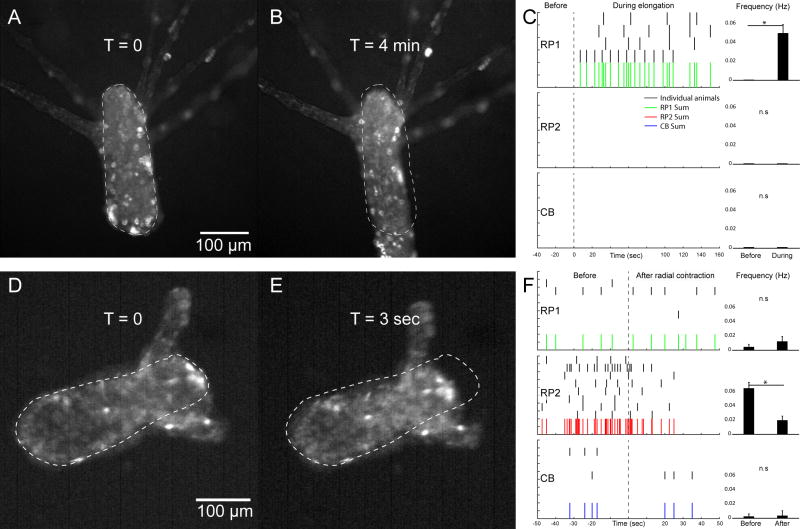
Figure 5. Behavioral association of two rhythmic potentials networks.
A. Dark-habituated animal at rest. B: elongation response during exposure to blue light (see Movie S3). Dashed line marks body contour of animal at rest. C: spike trains of RP1, RP2 and CB neurons in 4 animals, where t=0 indicates onset of elongation. Histograms compare firing frequency before vs during elongation response. D: Animal before radial contraction, a behavior that also occurs in unrestrained preparations (Movie S5). E: animal after radial contraction (see Movie S4). Dashed line marks body contour of animal before radial contraction. F: Spike trains of RP1, RP2 and CB neurons in 8 animals, where t=0 indicates radial contraction. Histograms compare firing frequency before vs after radial contraction. Data are represented as mean ± SEM. * indicates (P < 0.05, paired T-Test). See also Movies S3–S5.

