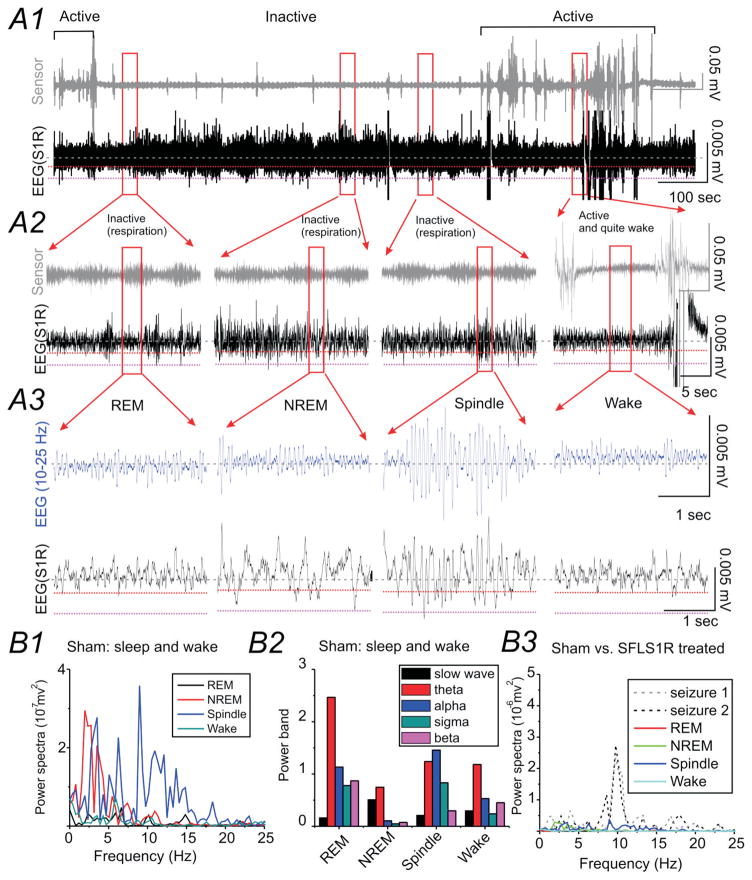
Figure 2. Normal EEG sleep waveforms in sham-treated animals.
(A) Representative EEG recording during normal sleep from the right S1 cortex (S1R) of a sham-treated mouse (A1). The top trace (grey) is a simultaneous recording from a piezo-electric floor sensor used to detect animal movement and respiration. The bottom trace (black) is the cortical S1R EEG recording. The red dotted line within the EEG recording shows a threshold voltage of 0.002 mV from baseline and the black dotted line marks voltage-value of 0.005 mV. EEG from selected areas (red square) are expanded in A2 and further expanded in A3 to demonstrate the spectro-temporal profile of the slow-wave, REM sleep and spindle activity observed during sleep and during quiet wake. A band-pass (10–25 Hz) filtered EEG signal (blue trace) is also shown to enhance the view of spindle activity. (B) Power analysis of EEG signals during sleep and wake. B1) Power spectrum analysis for each of the traces shown above. B2) Power-band data for different sleep and wake stages shown above. B3) The scale of the power-spectra for different sleep stages was set the same as in Figure 3B1 for comparison between SFLS1R-induced ictal-spike activities and sleep in this sham-treated animal.

