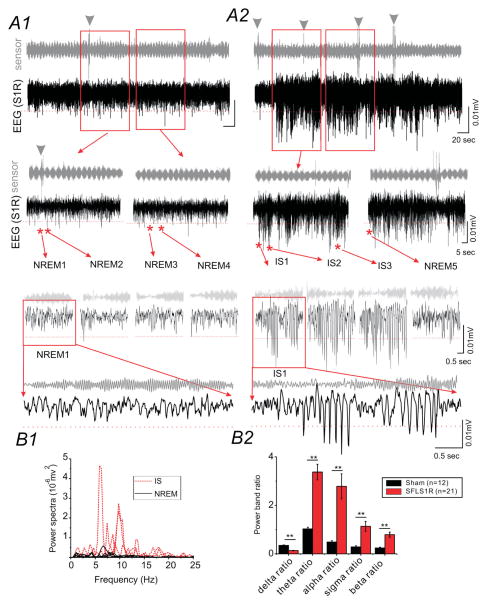
Figure 3. SFLS1R-induced electrographic seizures.
(A) Representative EEG recording from the right S1 cortex of an SFLS1R mouse which contains both normal sleep (A1) and the ictal (A2) state. The top trace (grey) is a simultaneous recording from a piezo-electric floor sensor. The bottom trace (black) is the cortical S1R EEG recording. The EEG traces from the selected (red squares) areas are further expanded to demonstrate the spectro-temporal profile of non-rapid eye movement (NREM) sleep versus ictal-spike (IS) activity. The red dotted line within EEG recording shows a threshold voltage of 0.005 mV from baseline The power spectrum derived from the representative NREM sleep (solid black lines) and IS activity (dotted red lines) are shown in B1. (B) Representative individual power-spectrum plot for traces shown above (B1) and quantitative power-band analysis of ictal-spikes (SFLS1R animals, n=21) vs. NREM sleep in selected cohort of animals (sham animals, n=12, **: p<0.01).

