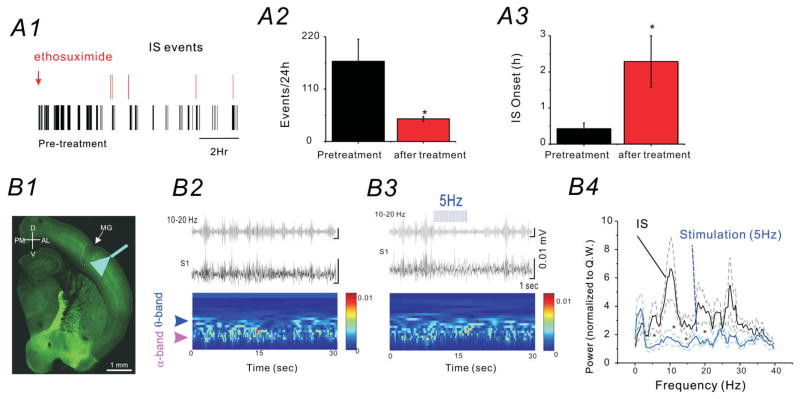
Figure 6. CSWS is modulated by ethosuximide and bilateral optogenetic cortical activation of GABAergic neurons.
(A) Effects of ethosuximide administration (2 mg/0.5 ml distilled water via i.p. bolus injection) on CSWS activity in SFLS1R mice. A1) Representative raster plot of each IS event detected during a 24 h period, prior to (black) and after (red) ethosuximide administration. A2) The total number of IS events recorded in a 24h period before (black) and after (red) ethosuximide administration (n=6, *p<0.05). A3) The onset of the first IS event detected after time 0 (sham-injection or ethosuximide injection, n=6, *p<0.05). (B) The effects of optogenetic activation of GABAergic neurons on CSWS activity in SFLS1R mice. B1) A thalamocortical brain slice from a SFLS1R/VGAT-ChR2 mouse showing the site of the microgyrus (MG) and the location of the fiber-optic implant. The green-fluorescence is derived from the endogenous fusion protein-YFP that was fused with the ChR2 gene. B2) Top: EEG recordings (black trace) of ictal-spikes and a 10–20 Hz band-pass filtered trace (grey) in S1R. Bottom: wavelet analysis showing the two characteristic power peaks in the α and θ band. B3) Top: Once the IS activity was detected, a 5 Hz optogenetic laser stimulation was applied in the adjacent ipsilateral (not shown) or contralateral (B3) S1 region. Bottom: α and θ band power was reduced when the 5 Hz optogenetic stimulation was applied. B4) Power-spectrum analysis of ictal-spikes with (blue) or without (black) 5 Hz optogenetic stimulation. The dotted lines represent the S.E. of the mean. n=6 mice, *: p<0.05.

