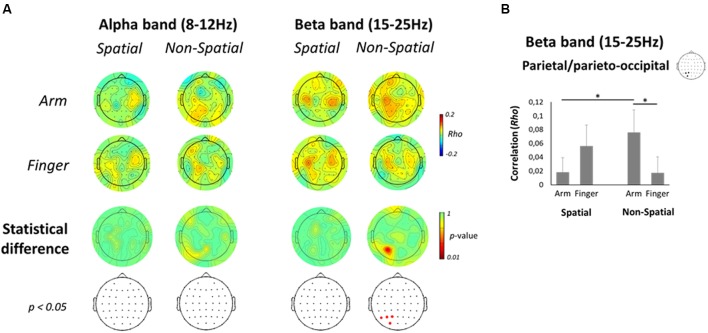
FIGURE 8.
Correlation between EEG activity and RT. (A, top two rows) Scalp topographic maps of correlation coefficients between alpha- (left) and beta-band (right) single-trial ERD values in the Late planning epoch and RTs, presented separately for each Effector and Precue condition. (A, bottom two rows) Scalp topographic maps of the statistical difference in correlation coefficients between the Arm and Finger conditions, along with the electrodes that survive a p < 0.05 criterion. (B) Mean correlation coefficient between beta-band ERD and RT for each Effector and Precue condition in the left parietal/parieto-occipital ROI. Asterisks denote a significant difference at p < 0.05.

