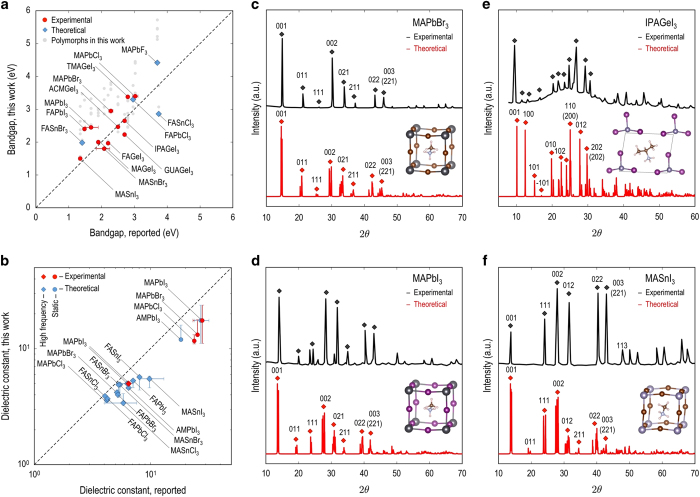
Figure 6. Validation of data computed for some HOIPs by comparing it with the measured data available.
Bandgap and dielectric constants computed for the low-energy structures of these compounds are plotted in (a,b) vs. those experimentally measured, respectively. In these panels, the lowest-energy structure of each HOIP is indicated by a colored symbol while data from the energetically competing structures are shown in gray (a) or given within an error bar (b). Experimental data of bandgap and dielectric constants of these HOIPs is obtained from refs 8,64,65,66,67 68,69 70,71 72,73 74,75 76,77 78,79 and refs 74–83, respectively. In (c–f), the simulated and measured XRD spectra for MAPbBr365, MAPbI384, IPAGeI373, and MASnI35,85, are shown. The reported index of reflection orientation is given on top of each significant peak.

