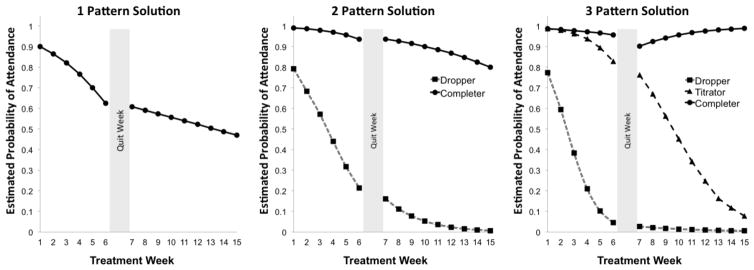
Figure 1.
Each panel in Figure 1 depicts a step in the latent growth class modeling analysis. Each step in the analysis allows for an additional cluster of individuals who followed a similar attendance pattern. The 3 pattern solution provides the most accurate description of participant’s engagement over the 15-week intervention

