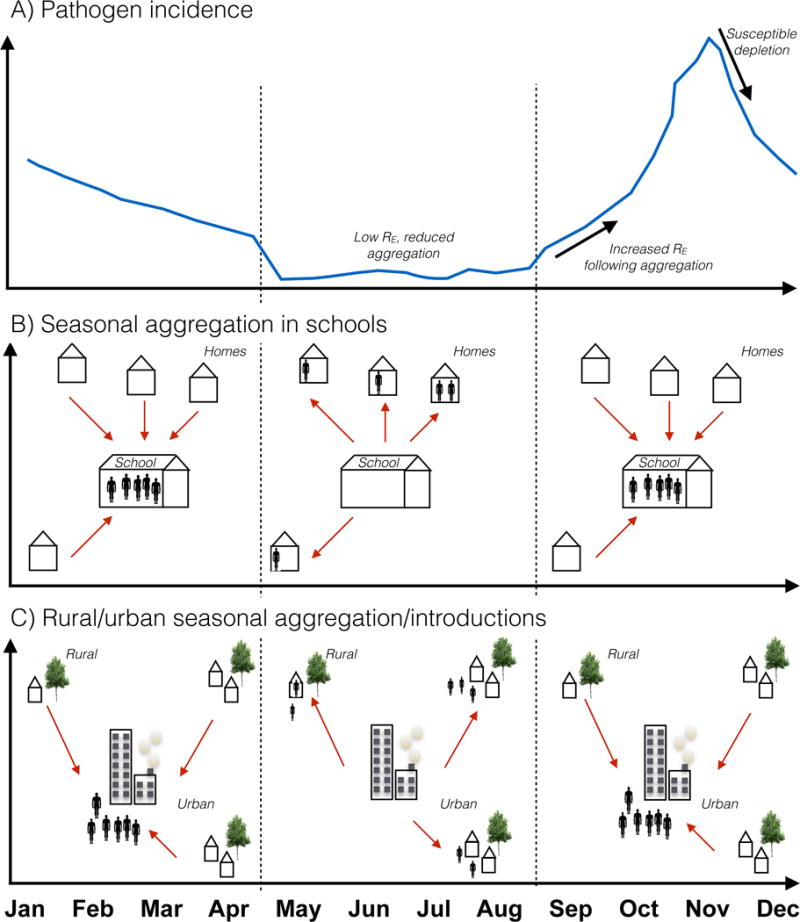
Figure 1. Seasonal movement and infectious disease dynamics.

A) Schematic incidence of an infection (blue line) showing cases (y axis) against time of year (x axis). A seasonal peak of incidence follows the summer. The underlying driver of this seasonal cycle is changes in the net reproductive number RE, or the number of new infections per infectious individual, because RE is the product of the basic reproductive number (R0, or the number of new infections in a completely susceptible population), and S, the size of the accessible susceptible population, which varies seasonally following human behavior, but also susceptible depletion by infection. Two possible scenarios are illustrated: B) Aggregation of children in schools after the summer holiday (red arrows) increases effective contact among susceptible individuals, thus altering RE and increasing incidence (reported for many childhood infections [1, 50, 54]); or C) Aggregation in cities after the period of agricultural work where communities have migrated out to rural settings (red arrows) results in an increase in RE (reported for measles in Niger [5])
