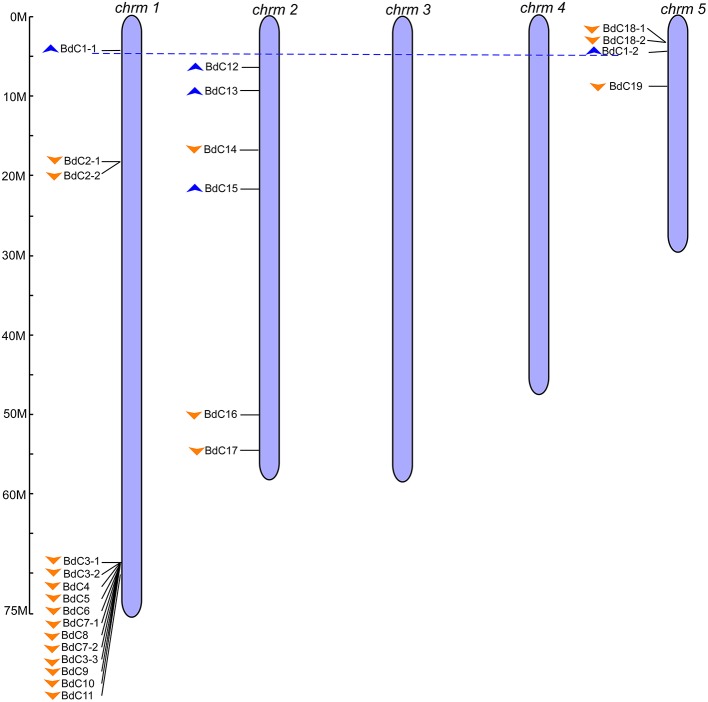
Figure 1.
Genomic distribution of B. distachyon cystatin (BdC) genes. Chromosome numbers are indicated at the top of each bar and the scales show their each size (Mb). Blue and orange triangles indicate the upward and downward direction of transcription, respectively. Blue dotted lines connect the BdC genes present on duplicate chromosomal segments. The ruler represented in mega bases (M).

