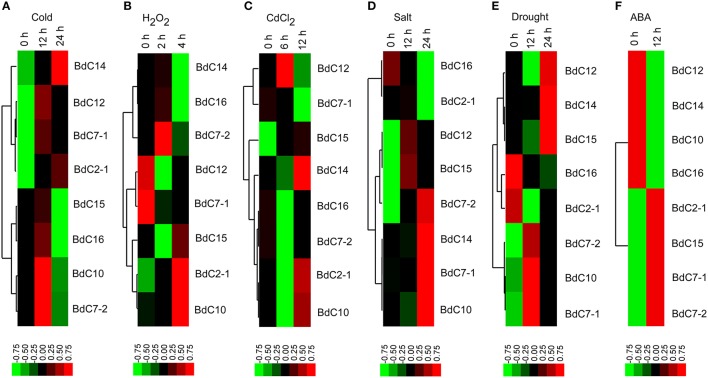
Figure 6.
Expression profiles of BdC family members in the leaves of B. distachyon in response to different abiotic stress treatments (cold, H2O2, CdCl2, drought, salt, and ABA) by qRT-PCR. Blocks with colors indicated decreased (green) or increased (red) transcript accumulation relative to the respective control. Filled squares indicate a significant difference from the control (p < 0.05) by using SPSS (Statistical Product and Service Solutions) software. Expression profiles of the BdC genes under cold (A), H2O2 (B), CdCl2 (C), drought (D), salt (E) and ABA (F) stresses from different time points are indicated.

