Figure 1.

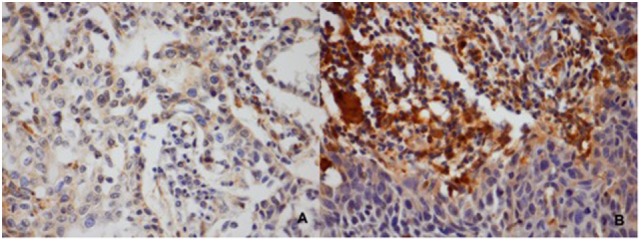
Classification of the GPx1 staining according to intensity and the percentage of stained cells. (A) Tumors classified as low levels of GPx1. (B) Tumor classified as high levels of GPx1.

Classification of the GPx1 staining according to intensity and the percentage of stained cells. (A) Tumors classified as low levels of GPx1. (B) Tumor classified as high levels of GPx1.