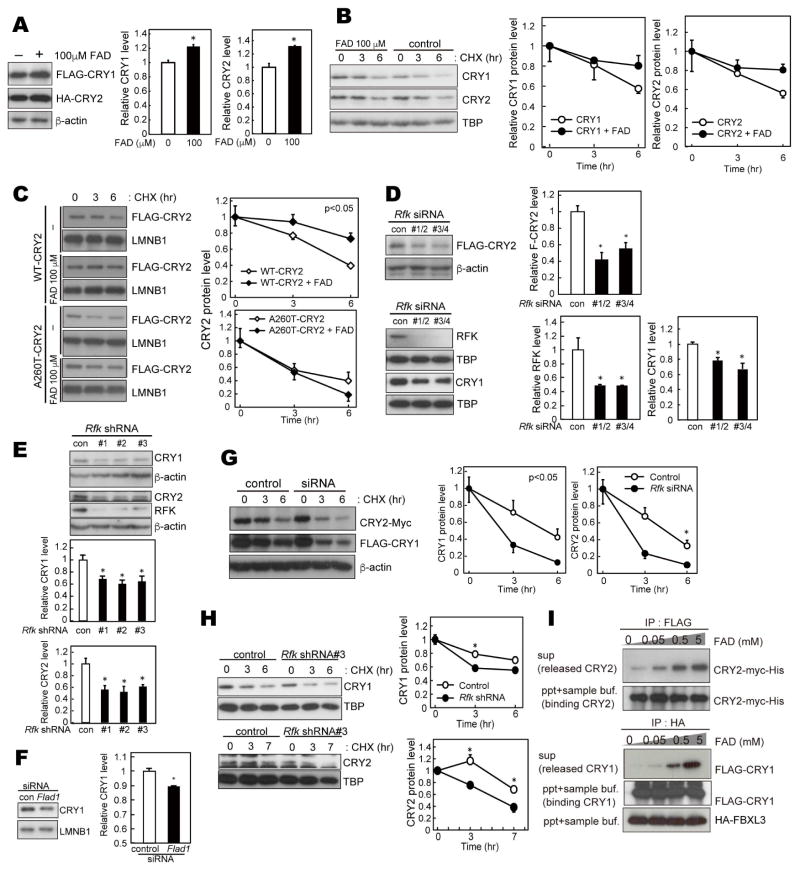
Figure 1. FAD stabilizes CRY protein.
(A) Effect of FAD on CRY1 and CRY2 protein levels in HEK293 total cell lysates. Forty-two hours after transfection, HEK293 cells were treated with 100 μM FAD for 6 hours. Data are shown as means with SEM (n=3, *: p<0.05 by Student’s t-test). (B) Degradation assay of endogenous CRY1 and CRY2 protein in NIH3T3 cells. The cells were pre-treated with 100 μM FAD (or PBS as a control) for 6 hours, and then treated with 100 μg/ml CHX and/or 100 μM FAD. Cells were fractionated, and nuclear extracts were used for western blotting analysis. CRY protein levels at the starting point (t=0 hours) were normalized to 1. Data are shown as means with SEM. (C) Degradation assay of WT-CRY2 and A260T-CRY2 protein in HEK293 cells. Forty-two hours after transfection, HEK293 cells were pre-treated with FAD for 6 hours and then treated with 100 μg/ml CHX and/or 100 μM FAD. Cells were fractionated. CRY protein levels in the nuclear fraction at t=0 hours were normalized to 1. Data are shown as means with SEM (n=3). Significance (p<0.05) was determined by two-way ANOVA. (D) CRY and RFK expression in NIH3T3 cells transfected with Rfk siRNAs. Over-expressed FLAG-CRY2, endogenous CRY1 and RFK protein levels were analyzed by western blotting (n=3, *: p<0.05 by Dunnett’s test). (E) CRY1 and CRY2 expression in NIH3T3 cells stably expressing Rfk shRNAs (n=3, *: p<0.05 by Dunnett’s test). (F) CRY1 expression in NIH3T3 cells transfected with Flad1 siRNAs (n=3, *: p<0.05 by Student’s t-test). (G) Degradation assay of CRY1 and CRY2 protein in Rfk knockdown cells. NIH3T3 cells were transfected with Rfk siRNA and CRY expression vectors. Forty-two hours after transfection, the cells were treated with 100 μg/ml CHX. Statistical significance (*: p<0.05) was determined by two-way ANOVA followed by Post-hoc test). (H) Degradation assay of endogenous CRY1 and CRY2 protein in NIH3T3 cells stably expressing Rfk shRNAs. Statistical significance (*: p<0.05) was determined by two-way ANOVA followed by post-hoc test). (I) FBXL3 competition assay. FLAG-CRY1-HA-FBXL3 or Myc-CRY2-FLAG-FBXL3 complexes expressed in HEK293 cells were purified using HA or FLAG antibody. FAD was added to CRY-FBXL3 complexes and incubated at 4 °C for 2 hours in vitro.

