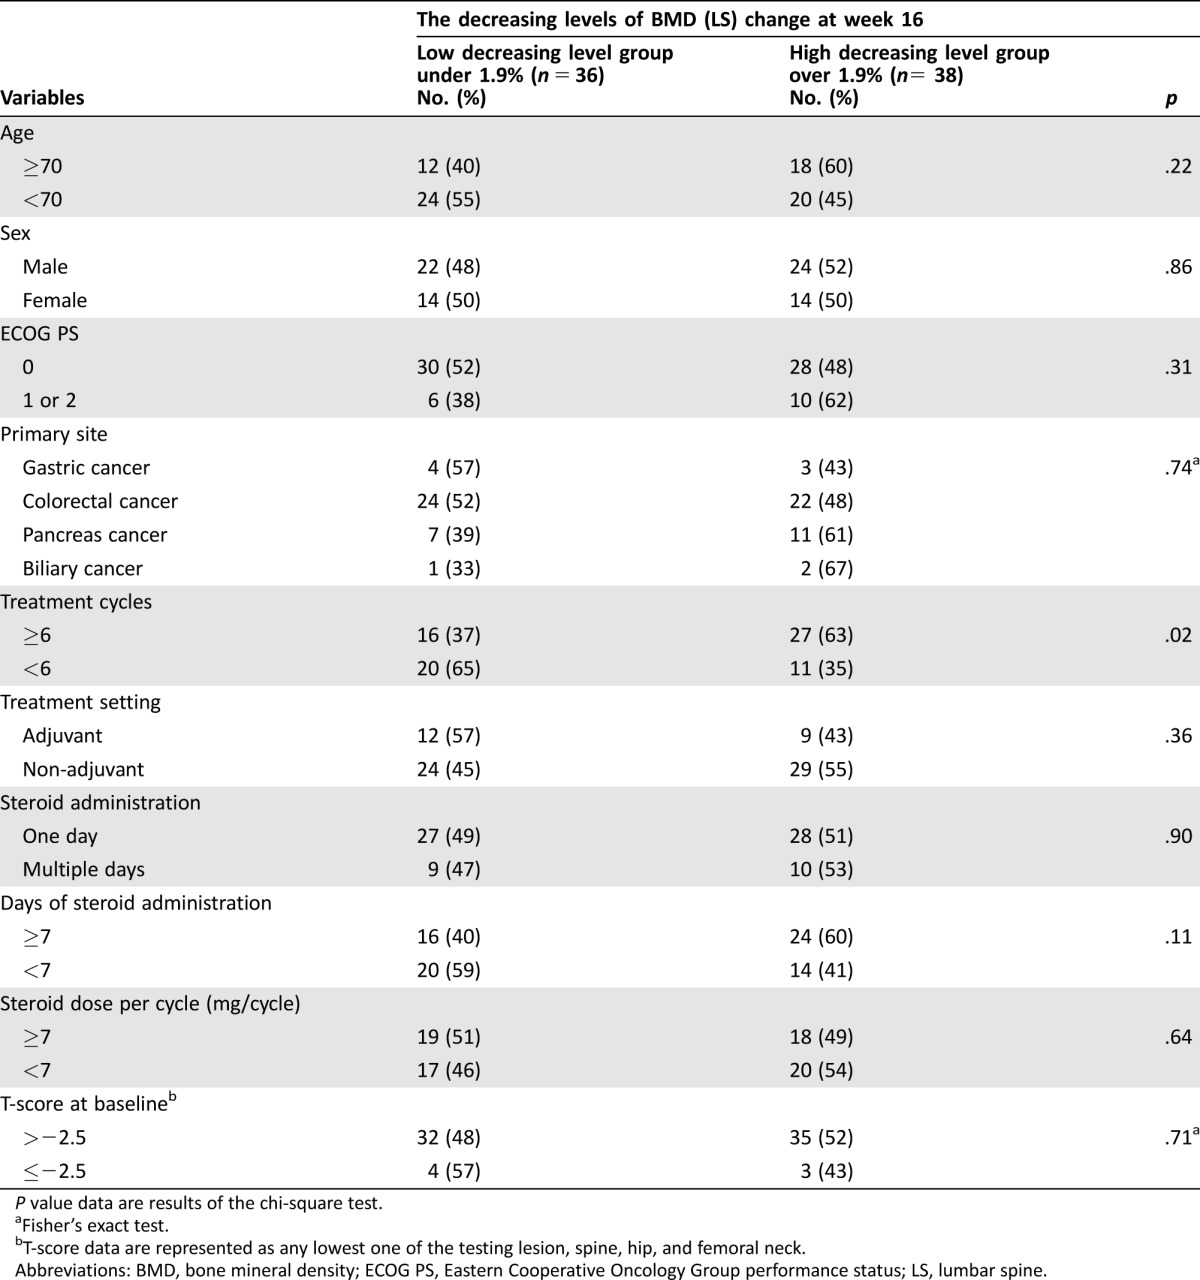
Table 4. Associations of BMD decreasing levels with various variables.

P value data are results of the chi‐square test.
Fisher's exact test.
T‐score data are represented as any lowest one of the testing lesion, spine, hip, and femoral neck.
Abbreviations: BMD, bone mineral density; ECOG PS, Eastern Cooperative Oncology Group performance status; LS, lumbar spine.
