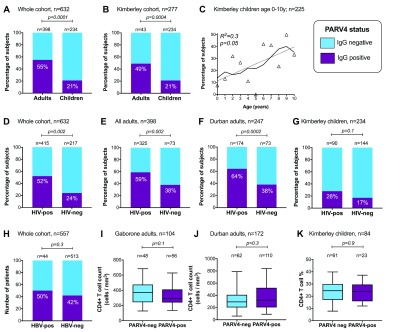
Figure 1.

Relationship between PARV4 IgG status and age ( A– C), HIV status ( D– G), and HBV status ( H– K). Boxes show median, 25 th and 75 th centiles; whiskers show 5 th–95 th centiles. P-values by Fisher’s exact test (bar charts), linear regression (scatter plot), and Mann Whitney U test (box and whisker plots). Denominator stated on each panel varies based on availability of relevant data.
