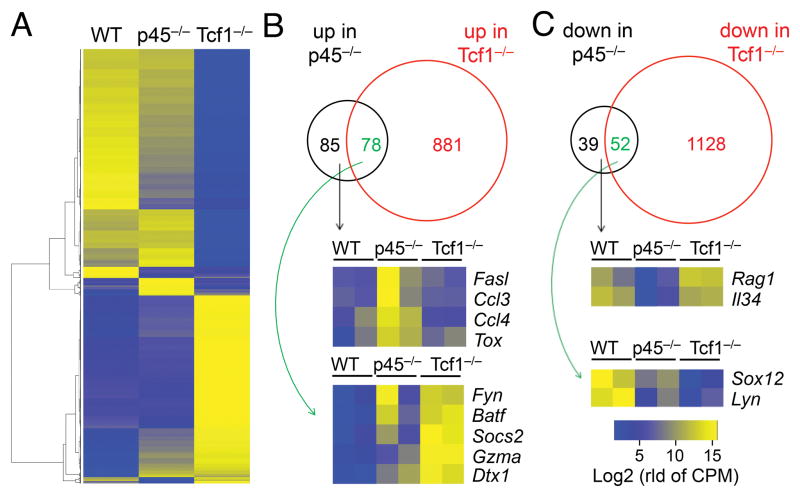
Figure 3. Loss of Tcf1 long isoforms minimally affects DN3 transcriptome.
(A) Heatmap showing differentially regulated genes (DEGs) in p45−/− and Tcf1−/− DN3 thymocytes. DN3 thymocytes were sort-purified from WT, p45−/−, or Tcf1−/− mice (each in two replicates) and analyzed by RNA-Seq. DEGs were identified using DESeq2 under permissive criteria (≥1.5 fold expression changes and p<0.05), and the average of two replicates in each genotype were used in cluster analysis.
(B)–(C) Venn diagrams showing upregulated (B) and downregulated (C) genes in p45−/− and Tcf1−/− DN3 thymocytes. Select genes of interest that are differentially expressed in p45−/− cells are shown in heatmaps. In color scale, “rld of CPM” stands for “regularized log transform of counts per million”.

