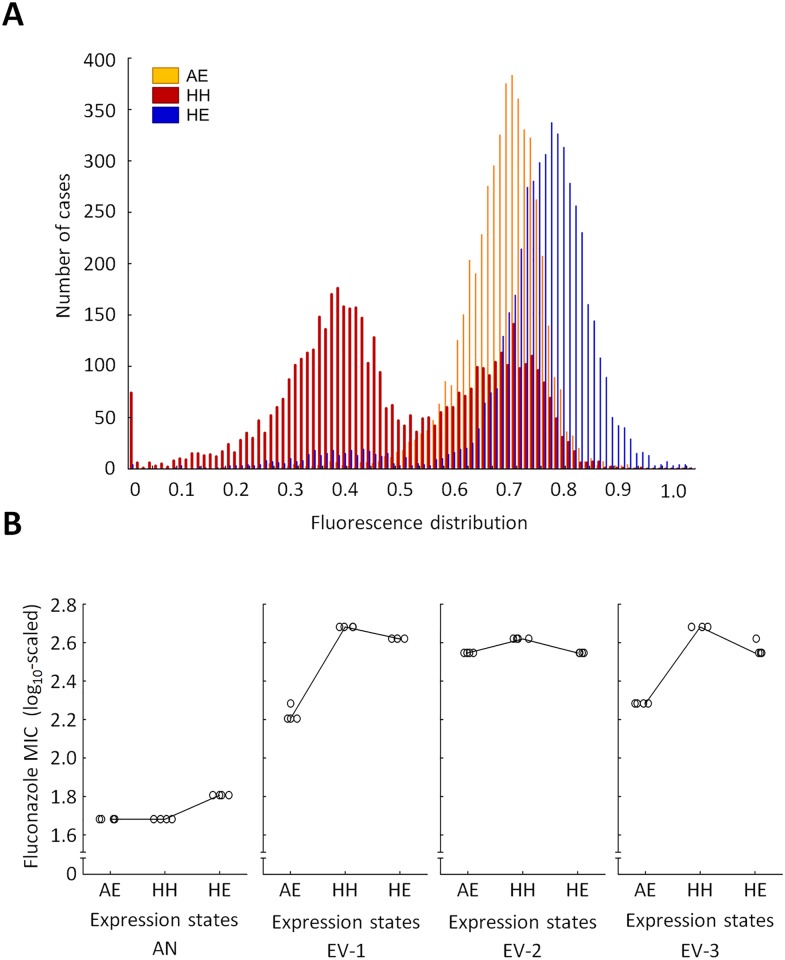
Fig 4. Phenotypic heterogeneity modulates the effect of mutations on resistance level.
(A) Distribution of C-terminally GFP-tagged Pdr5p protein (Pdr5p-GFP) fluorescence level at three different expression states by flow cytometry. The histograms show the fluorescence distributions of Pdr5p-GFP, as follows: positive feedback (PF) with high phenotypic heterogeneity (HH), no positive feedback (noPF) with adjusted expression level (AE), and PF with high expression level (HE). The inducer levels were set to 0.2 μg/ml doxycycline (AE in noPF strain), 0.3 μg/ml doxycycline (HH in PF strain), and 3 μg/ml doxycycline (HE in PF strain), respectively. (B) Comparison of HH, AE, and HE. The figure shows the minimum inhibitory concentrations (MIC) of the ancestor (AN) and three evolved (EV) PF strains (EV-1, EV-2, and EV-3) in three different expression settings. The settings were HH, AE, and HE. In the ancestor, the AE and HH settings reached the same resistance level, as expected (Mann–Whitney U test, p = not significant), while the HE setting reached higher MIC level than HH (Mann–Whitney U test, p < 0.05). In the evolved strains (EV-1, EV-2, and EV-3), however, the MIC level of the HH setting was somewhat higher than that of AE (Mann–Whitney U test, p < 0.05) or HE (Mann–Whitney U test, p < 0.05). Four independent cultures per strain were grown and measured for MIC (empty circles). The data underlying Fig 4 can be found in S1 Data.

