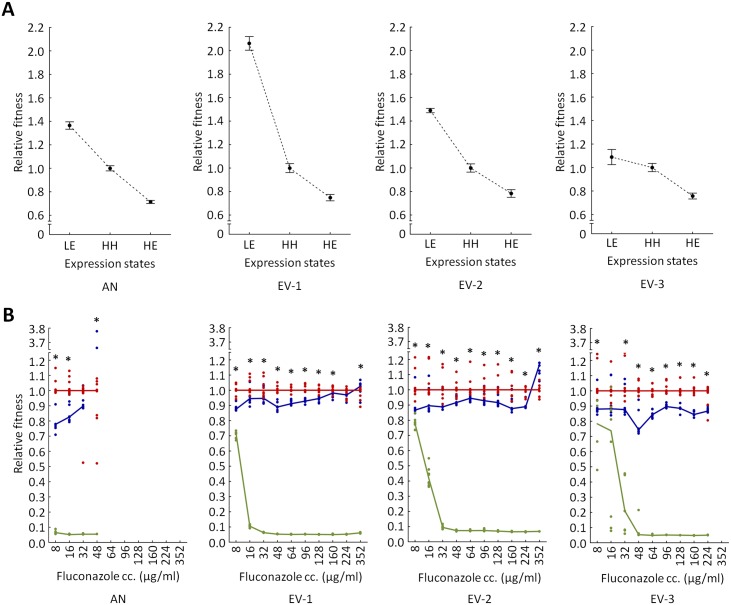
Fig 6. Comparison of phenotypic heterogeneity and constitutively high gene expression.
(A) High expression level (HE) of PDR5 imposes a fitness cost. The figure shows the mean relative fitness of four genotypes at different expression states in drug-free medium. The genotypes studied were the ancestor (AN) positive feedback (PF) and three evolved (EV) PF strains (EV-1, EV-2 and EV-3). The three expression states were as follows: low expression level (LE), HE, and the original high phenotypic heterogeneity (HH) setting (for further details see S8 Fig). Absolute fitness was estimated by the increment of the OD600 after 72 h of growth in drug-free medium. Relative fitness was calculated by normalizing to the absolute fitness of the corresponding strain in the HH expression state. Error bars indicate 95% confidence intervals, based on growth measurement of at least 60 independent cultures per expression state. (B) Phenotypic heterogeneity provides fitness advantage under fluconazole stress. The figure shows the relative fitness of four genotypes as a function of increasing fluconazole concentrations. The genotypes studied were the AN PF and three EV PF strains (EV-1, EV-2 and EV-3). Green line indicates LE, blue line indicates HE, while the red line indicates intermediate expression level with HH. Fitness was estimated by the OD600 values after 72 h of growth and was normalized to the fitness in the HH expression setting at each fluconazole dosage. The continuous lines connect the median relative fitnesses, based on growth measurement of eight independent cultures for each expression setting. * indicates significant fitness difference between HE and HH expression settings (Mann–Whitney U test, p < 0.05). In both panel A and B, the inducer levels were set to 0.015 μg/ml (LE), 0.3 μg/ml (HH), and 3 μg/ml (HE), respectively. For further details, see the main text. The data underlying Fig 6 can be found in S1 Data.

