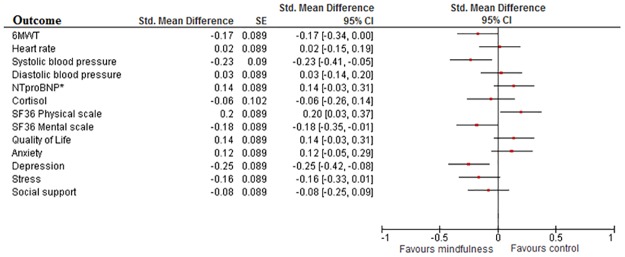
Fig 3. Cohen’s D in as-treated analysis.
Plot showing Cohen’s D effect measures of online mindfulness compared to treatment as usual in the As-Treated analysis. All values lower than 0 indicate a significant difference in favour of mindfulness. The breadth of the line indicates the 95%CI. Values between 0 and -0.2 indicate negligible effect; between -0.2 and -0.5 small effect; between -0.5 and -0.8 medium effect and lower than -0.8 a large effect. *: log transformed values.

