
Fig 3. Area under the curve of RCF predictions.
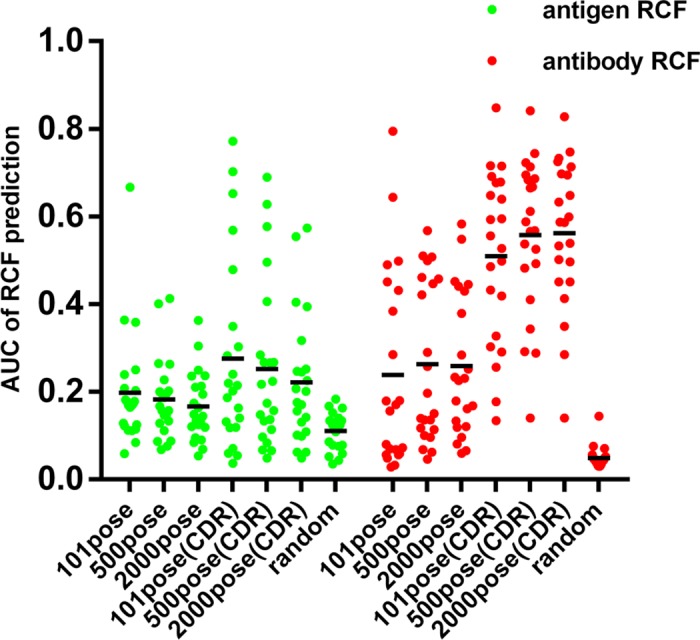
Base on both the whole antibody and CDR loops, the RCF scores of 22 antigen-antibody pairs were calculated using the top 101, 500, and 2000 conformations respectively. Then the areas under the PR curves were calculated and shown. AUC of random predictions were used to assess whether RCF results are better than random. Each point indicates a different antibody/antigen pairing.