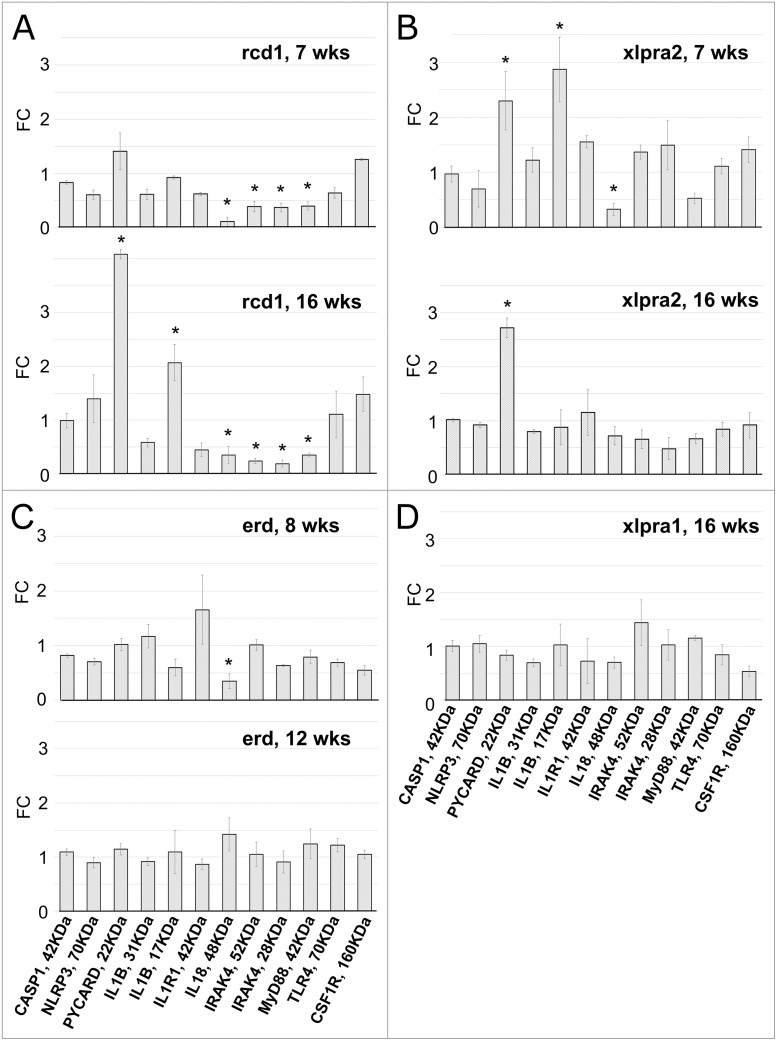
Fig 3. Protein quantification in retinas of rcd1 (A), xlpra2 (B), erd (C) and xlpra1 (D) models.
Quantification of pro-inflammatory proteins on western blots (Fig 2A) normalized against the corresponding housekeeping protein (ACTB) was done using Li-COR Odyssey Fc and represented as fold-changes compared to the normal tissue values. Differences in relative fluorescence (Y-axis) for the proteins analyzed (X-axis) show CASP1, NLRP3, IL1B-precursor, IL1R1, TLR4 and CSF1R in disease (rcd1, xlpra2, erd, xlpra1) were similar to normal levels at all ages. In contrast, two proteins were increased over normal levels: mature ILIB-17 KDa (7 wks xlpra2, 16 wks rcd1) and PYCARD (7 wks xlpra2, 16 wks xlpra2, 16 wks rcd1). Moreover, three proteins were below normal levels: MYD88 (7 wks rcd1, 16 wks rcd1), IRAK4 (7 wks rcd1, 16 wks rcd1) and IL18-precursor (7 wks rcd1, 16 wks rcd1, 8 wks erd, 7 wks xlpra2). * indicates significance level 5% (p<0.05).

