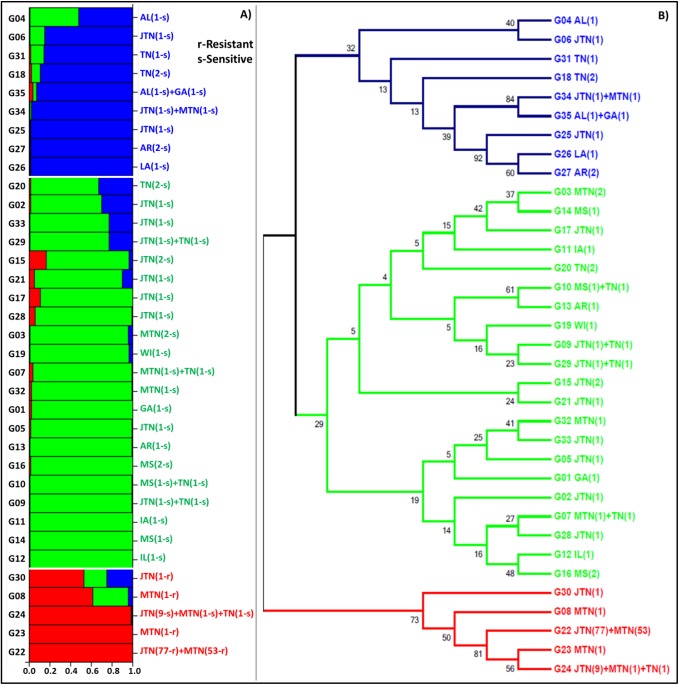
Fig 3. Clustering of 35 unique genotypes recovered from 186 samples of C. sojina.
(A) Bayesian Structure analyses place genotypes into three clusters. Each genotype is followed by the location(s) and a number of resistant “r” or sensitive “s” isolates in brackets. (B) Maximum likelihood tree constructed using MEGA 6.06, colored to match the three groups revealed by Bayesian Structure analysis.

