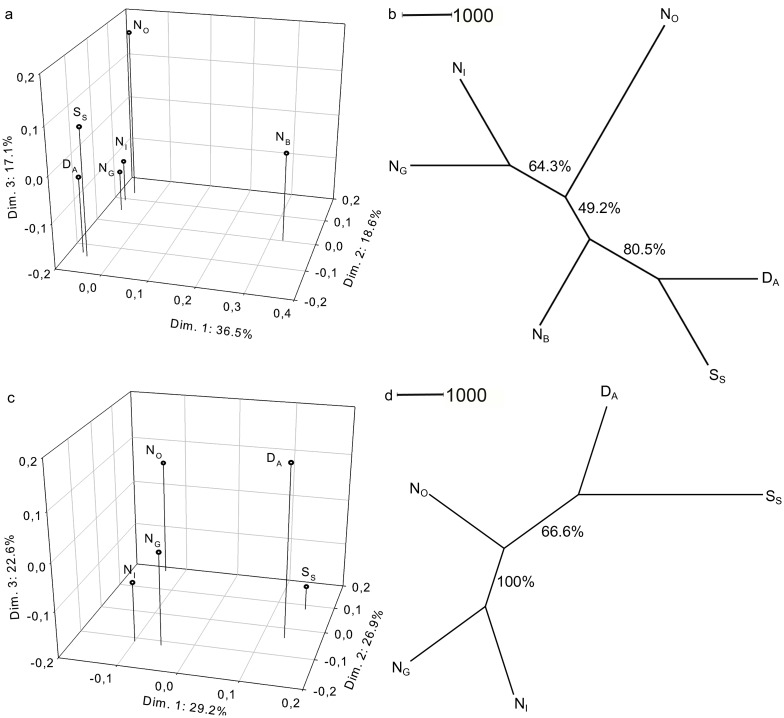
Fig 2. Genetic distance.
Similarities and differences among Norwegian (NB, NO, NI, NG), Swedish (SS) and Danish (DA) Pacific oyster (Crassostrea gigas) populations visualized by Chords distance [57] in a Principal Coordinate analysis (a and c) and Neighbour Joining tree plot (b and d). Based on all sampled locations (a and b), and for all locations except location NB (c and d), to explore and visualize the genetic distances without location NB that act as an outlier in the data set. Overview of the sampled oyster locations and abbreviations are given in Table 1.

